


| Duration | 0:00 | Takeoff Distance | 0 |
| Height: | metres |
| Climb: | m/sec |
| Speed: | km/h |
| Distance: | km |
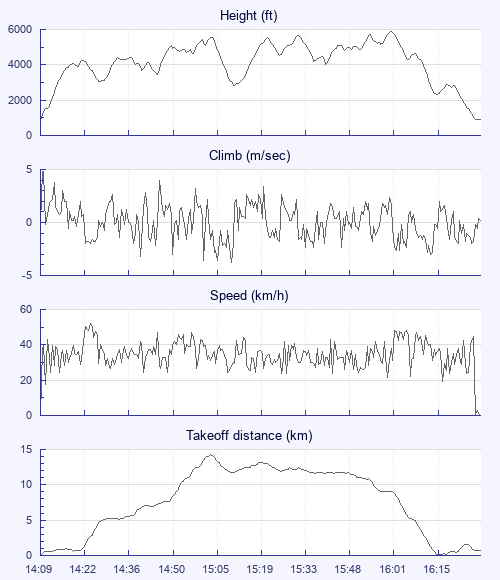
| Height - GPS data | |
| Maximum Height [16:03:58] |
5879 ft |
| Lowest Save [16:19:11] |
2300 ft |
| Takeoff Height [14:09:23] |
876 ft |
| Landing Height [16:32:11] |
919 ft |
| Total Ascent | 18799 ft |
| Height Gain | |
| Above Takeoff | 5003 ft |
| Units | |
| Climb - GPS data | |
| Maximum Climb [14:09:53] |
4.8 m/s |
| Minimum Climb [15:11:23] |
-3.8 m/s |
| Units | |
| Speed | |
| Maximum Speed [14:24:58] |
51.8 km/h |
| Average Speed around course |
17.4 km/h |
| Average Speed over track length |
34.4 km/h |
| Units | |
| Tracklog | |
| Flight Duration | 2hrs 22mins |
| Track Points | 1714 |
| Recording Interval | 5 secs |
| Statistics Interval | 5 secs |
| Track Length | 81.9 km |
| Units | |
| Flight instrument - reported as | |
| GPSMAP 76 Software Version 3.90 |
| Height: | |
| Speed: | |
| Climb: | |
| Distance: |
| Main Map: |
| First Tab: |