


| Duration | 0:00 | Takeoff Distance | 0 |
| Height: | metres |
| Climb: | m/sec |
| Speed: | km/h |
| Distance: | km |
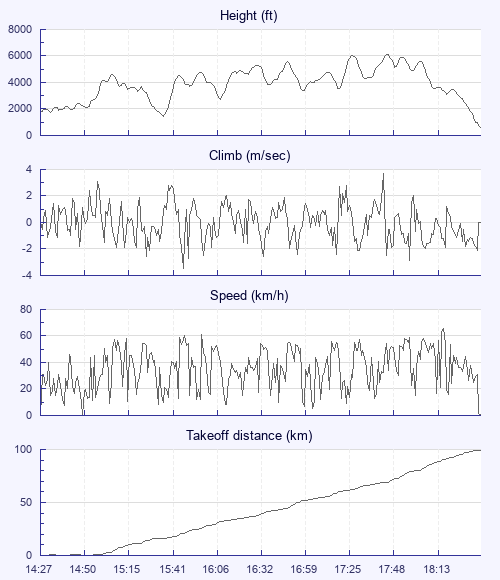
| Height - GPS data | |
| Maximum Height [17:46:42] |
6135 ft |
| Lowest Save [15:36:49] |
1457 ft |
| Takeoff Height [14:27:35] |
1860 ft |
| Landing Height [18:38:01] |
640 ft |
| Total Ascent | 22221 ft |
| Height Gain | |
| Above Takeoff | 4275 ft |
| Maximum | 4678 ft |
| Low Point as Lowest Save |
1457 ft |
| High Point as Maximum Height |
6135 ft |
| Units | |
| Climb - Pressure data | |
| Maximum Climb [17:45:42] |
3.7 m/s |
| Minimum Climb [15:48:11] |
-3.5 m/s |
| Units | |
| Speed | |
| Maximum Speed [18:18:37] |
65.5 km/h |
| Average Speed around course |
26.8 km/h |
| Average Speed over track length |
34.4 km/h |
| Units | |
| Tracklog | |
| Flight Duration | 4hrs 10mins |
| Track Points | 1499 |
| Recording Interval | 10 secs |
| Statistics Interval | 10 secs |
| Track Length | 143.7 km |
| Units | |
| Flight instrument - reported as | |
| 5020, SN05888, SW1.22 |
| Height: | |
| Speed: | |
| Climb: | |
| Distance: |
| Main Map: |
| First Tab: |