


| Duration | 0:00 | Takeoff Distance | 0 |
| Height: | metres |
| Climb: | m/sec |
| Speed: | km/h |
| Distance: | km |
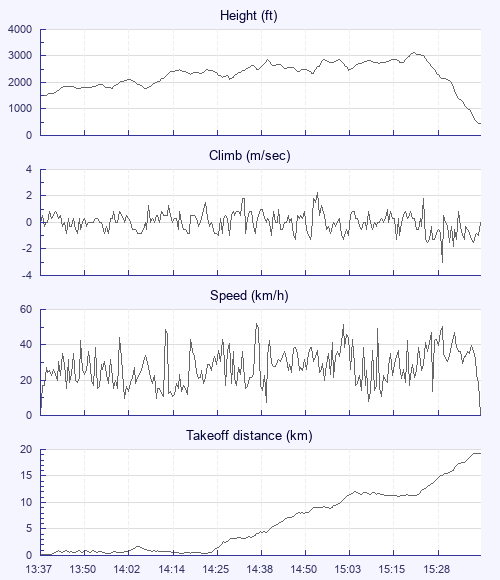
| Height - GPS data | |
| Maximum Height [15:22:16] |
3120 ft |
| Lowest Save [14:06:40] |
1775 ft |
| Takeoff Height [13:37:44] |
1490 ft |
| Landing Height [15:39:48] |
466 ft |
| Total Ascent | 6073 ft |
| Height Gain | |
| Above Takeoff | 1631 ft |
| Units | |
| Climb - GPS data | |
| Maximum Climb [14:54:24] |
2.3 m/s |
| Minimum Climb [15:30:00] |
-3.0 m/s |
| Units | |
| Speed | |
| Maximum Speed [14:37:20] |
52.2 km/h |
| Average Speed around course |
13.0 km/h |
| Average Speed over track length |
28.0 km/h |
| Units | |
| Tracklog | |
| Flight Duration | 2hrs 2mins |
| Track Points | 1832 |
| Recording Interval | 4 secs |
| Statistics Interval | 4 secs |
| Track Length | 56.9 km |
| Units | |
| Flight instrument - reported as | |
| XC Trainer V3.2-07, S/N 4043 |
| Height: | |
| Speed: | |
| Climb: | |
| Distance: |
| Main Map: |
| First Tab: |