


| Duration | 0:00 | Takeoff Distance | 0 |
| Height: | metres |
| Climb: | m/sec |
| Speed: | km/h |
| Distance: | km |
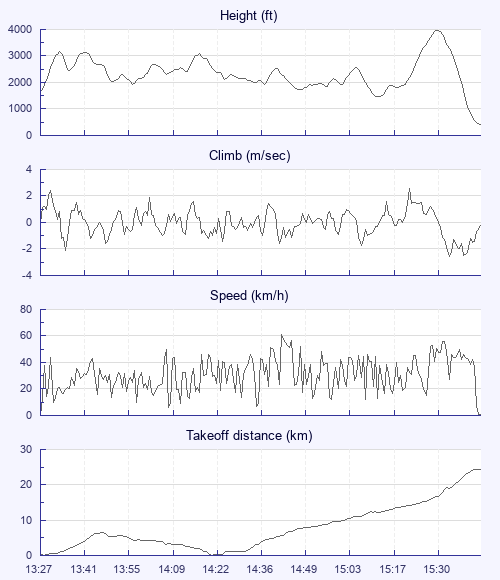
| Height - GPS data | |
| Maximum Height [15:30:29] |
3963 ft |
| Lowest Save [15:12:59] |
1453 ft |
| Takeoff Height [13:27:30] |
1650 ft |
| Landing Height [15:42:05] |
430 ft |
| Total Ascent | 9219 ft |
| Height Gain | |
| Above Takeoff | 2313 ft |
| Maximum | 2510 ft |
| Low Point as Lowest Save |
1453 ft |
| High Point as Maximum Height |
3963 ft |
| Units | |
| Climb - GPS data | |
| Maximum Climb [15:22:14] |
2.6 m/s |
| Minimum Climb [15:33:42] |
-2.6 m/s |
| Units | |
| Speed | |
| Maximum Speed [14:42:33] |
61.2 km/h |
| Average Speed around course |
17.3 km/h |
| Average Speed over track length |
30.5 km/h |
| Units | |
| Tracklog | |
| Flight Duration | 2hrs 14mins |
| Track Points | 801 |
| Recording Interval | 10 secs |
| Statistics Interval | 10 secs |
| Track Length | 68.5 km |
| Units | |
| Flight instrument - reported as | |
| 5020, SN05874, SW1.16 |
| Height: | |
| Speed: | |
| Climb: | |
| Distance: |
| Main Map: |
| First Tab: |