


| Duration | 0:00 | Takeoff Distance | 0 |
| Height: | metres |
| Climb: | m/sec |
| Speed: | km/h |
| Distance: | km |
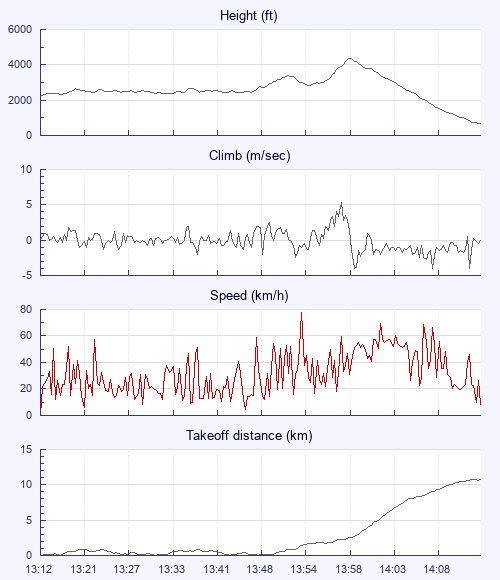
| Height - GPS data | |
| Maximum Height [13:59:13] |
4364 ft |
| Lowest Save [13:54:48] |
2825 ft |
| Takeoff Height [13:12:23] |
2280 ft |
| Landing Height [14:15:02] |
676 ft |
| Total Ascent | 4777 ft |
| Height Gain | |
| Above Takeoff | 2083 ft |
| Maximum | 2093 ft |
| Low Point [13:12:33] |
2270 ft |
| High Point as Maximum Height |
4364 ft |
| Units | |
| Climb - GPS data | |
| Maximum Climb [13:58:25] |
5.3 m/s |
| Minimum Climb [13:59:30] |
-4.0 m/s |
| Units | |
| Speed | |
| Maximum Speed [13:54:14] |
77.4 km/h |
| Average Speed around course |
10.3 km/h |
| Average Speed over track length |
25.6 km/h |
| Units | |
| Tracklog | |
| Flight Duration | 1hr 2mins |
| Track Points | 1572 |
| Recording Interval | 2 secs |
| Statistics Interval | 4 secs |
| Track Length | 26.7 km |
| Invalid Positions [1.8%] |
28 |
| Units | |
| Height: | |
| Speed: | |
| Climb: | |
| Distance: |
| Main Map: |
| First Tab: |