


| Duration | 0:00 | Takeoff Distance | 0 |
| Height: | metres |
| Climb: | m/sec |
| Speed: | km/h |
| Distance: | km |
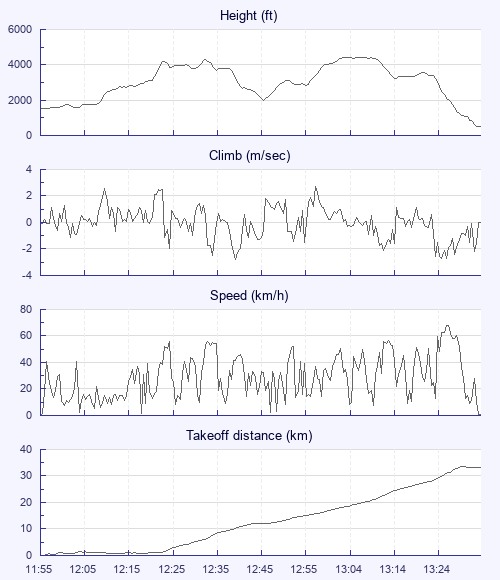
| Height - GPS data | |
| Maximum Height [13:05:31] |
4432 ft |
| Lowest Save [12:47:12] |
1998 ft |
| Takeoff Height [11:55:36] |
1526 ft |
| Landing Height [13:35:33] |
499 ft |
| Total Ascent | 7802 ft |
| Height Gain | |
| Above Takeoff | 2907 ft |
| Maximum | 2913 ft |
| Low Point [11:55:51] |
1519 ft |
| High Point as Maximum Height |
4432 ft |
| Units | |
| Climb - GPS data | |
| Maximum Climb [12:59:01] |
2.7 m/s |
| Minimum Climb [12:40:42] |
-2.8 m/s |
| Units | |
| Speed | |
| Maximum Speed [13:29:03] |
68.2 km/h |
| Average Speed around course |
22.5 km/h |
| Average Speed over track length |
28.8 km/h |
| Units | |
| Tracklog | |
| Flight Duration | 1hr 39mins |
| Track Points | 400 |
| Recording Interval | 15 secs |
| Statistics Interval | 15 secs |
| Track Length | 47.9 km |
| Units | |
| Flight instrument - reported as | |
| GPSMap76CSX Software Version 3.50 |
| Height: | |
| Speed: | |
| Climb: | |
| Distance: |
| Main Map: |
| First Tab: |