


| Duration | 0:00 | Takeoff Distance | 0 |
| Height: | metres |
| Climb: | m/sec |
| Speed: | km/h |
| Distance: | km |
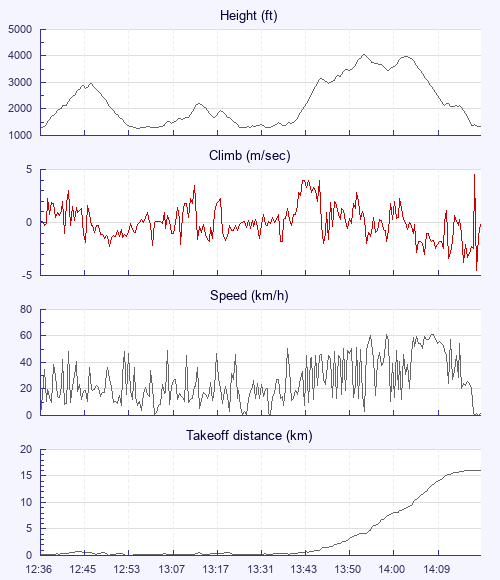
| Height - GPS data | |
| Maximum Height [13:55:24] |
4049 ft |
| Lowest Save [12:56:18] |
1270 ft |
| Takeoff Height [12:36:26] |
1296 ft |
| Landing Height [14:17:44] |
1335 ft |
| Total Ascent | 9065 ft |
| Height Gain | |
| Above Takeoff | 2753 ft |
| Maximum | 2779 ft |
| Low Point as Lowest Save |
1270 ft |
| High Point as Maximum Height |
4049 ft |
| Units | |
| Climb - GPS data | |
| Maximum Climb [14:17:17] |
4.5 m/s |
| Minimum Climb [14:17:20] |
-4.5 m/s |
| Units | |
| Speed | |
| Maximum Speed [14:00:57] |
61.2 km/h |
| Average Speed around course |
11.5 km/h |
| Average Speed over track length |
23.6 km/h |
| Units | |
| Tracklog | |
| Flight Duration | 1hr 41mins |
| Track Points | 1825 |
| Recording Interval | 3 secs |
| Statistics Interval | 6 secs |
| Track Length | 39.8 km |
| Invalid Heights [< 1%] |
3 |
| Units | |
| Flight instrument - reported as | |
| GPSMap76CSX Software Version 3.90 |
| Height: | |
| Speed: | |
| Climb: | |
| Distance: |
| Main Map: |
| First Tab: |