


| Duration | 0:00 | Takeoff Distance | 0 |
| Height: | metres |
| Climb: | m/sec |
| Speed: | km/h |
| Distance: | km |
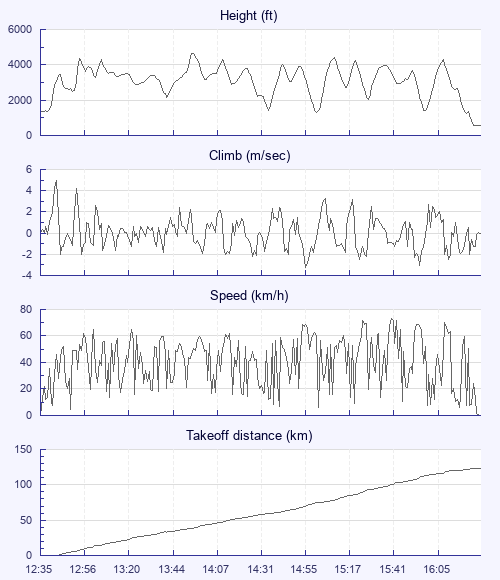
| Height - GPS data | |
| Maximum Height [13:57:06] |
4642 ft |
| Lowest Save [15:05:02] |
1329 ft |
| Takeoff Height [12:35:26] |
1283 ft |
| Landing Height [16:33:37] |
574 ft |
| Total Ascent | 28517 ft |
| Height Gain | |
| Above Takeoff | 3360 ft |
| Maximum | 3366 ft |
| Low Point [12:35:31] |
1276 ft |
| High Point as Maximum Height |
4642 ft |
| Units | |
| Climb - GPS data | |
| Maximum Climb [12:41:46] |
5.0 m/s |
| Minimum Climb [14:59:42] |
-3.2 m/s |
| Units | |
| Speed | |
| Maximum Speed [15:46:32] |
73.4 km/h |
| Average Speed around course |
30.1 km/h |
| Average Speed over track length |
41.0 km/h |
| Units | |
| Tracklog | |
| Flight Duration | 3hrs 58mins |
| Track Points | 2858 |
| Recording Interval | 5 secs |
| Statistics Interval | 10 secs |
| Track Length | 162.8 km |
| Units | |
| Flight instrument - reported as | |
| GPSMAP 76S Software Version 4.00 |
| Height: | |
| Speed: | |
| Climb: | |
| Distance: |
| Main Map: |
| First Tab: |