


| Duration | 0:00 | Takeoff Distance | 0 |
| Height: | metres |
| Climb: | m/sec |
| Speed: | km/h |
| Distance: | km |
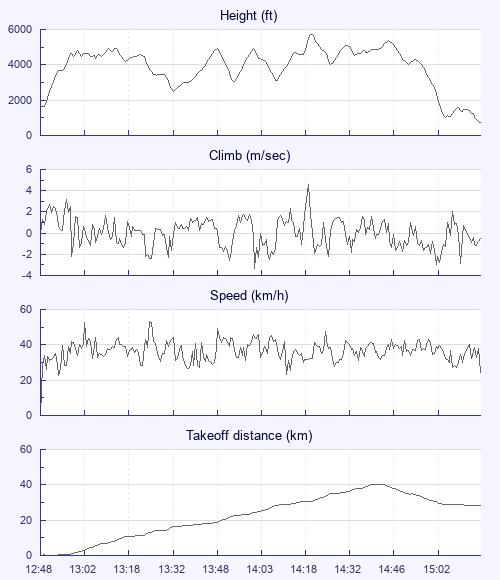
| Height - GPS data | |
| Maximum Height [14:23:33] |
5725 ft |
| Lowest Save [15:10:18] |
1014 ft |
| Takeoff Height [12:48:57] |
1604 ft |
| Landing Height [15:22:53] |
715 ft |
| Total Ascent | 16788 ft |
| Height Gain | |
| Above Takeoff | 4121 ft |
| Maximum | 4157 ft |
| Low Point [12:49:22] |
1568 ft |
| High Point as Maximum Height |
5725 ft |
| Units | |
| Climb - GPS data | |
| Maximum Climb [14:22:58] |
4.6 m/s |
| Minimum Climb [14:03:48] |
-3.3 m/s |
| Units | |
| Speed | |
| Maximum Speed [13:26:47] |
53.3 km/h |
| Average Speed around course |
22.4 km/h |
| Average Speed over track length |
36.9 km/h |
| Units | |
| Tracklog | |
| Flight Duration | 2hrs 33mins |
| Track Points | 1848 |
| Recording Interval | 5 secs |
| Statistics Interval | 9 secs |
| Track Length | 94.7 km |
| Units | |
| Flight instrument - reported as | |
| GPSMAP 76S Software Version 3.60 |
| Height: | |
| Speed: | |
| Climb: | |
| Distance: |
| Main Map: |
| First Tab: |