


| Duration | 0:00 | Takeoff Distance | 0 |
| Height: | metres |
| Climb: | m/sec |
| Speed: | km/h |
| Distance: | km |
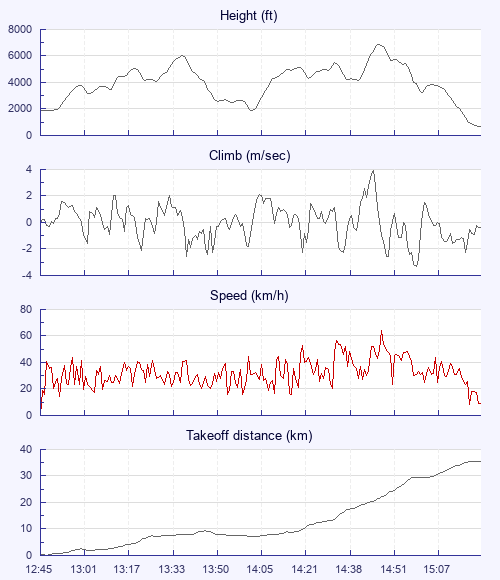
| Height - GPS data | |
| Maximum Height [14:50:59] |
6870 ft |
| Lowest Save [14:04:35] |
1893 ft |
| Takeoff Height [12:45:51] |
1844 ft |
| Landing Height [15:25:53] |
659 ft |
| Total Ascent | 14816 ft |
| Height Gain | |
| Above Takeoff | 5026 ft |
| Units | |
| Climb - GPS data | |
| Maximum Climb [14:49:40] |
3.9 m/s |
| Minimum Climb [15:03:28] |
-3.3 m/s |
| Units | |
| Speed | |
| Maximum Speed [14:51:42] |
63.9 km/h |
| Average Speed around course |
17.1 km/h |
| Average Speed over track length |
31.9 km/h |
| Units | |
| Tracklog | |
| Flight Duration | 2hrs 40mins |
| Track Points | 3152 |
| Recording Interval | 3 secs |
| Statistics Interval | 12 secs |
| Track Length | 85.1 km |
| Invalid Positions [< 1%] |
1 |
| Units | |
| Flight instrument - reported as | |
| COMPETINO, SN00593, SW1.16 |
| Height: | |
| Speed: | |
| Climb: | |
| Distance: |
| Main Map: |
| First Tab: |