


| Duration | 0:00 | Takeoff Distance | 0 |
| Height: | metres |
| Climb: | m/sec |
| Speed: | km/h |
| Distance: | km |
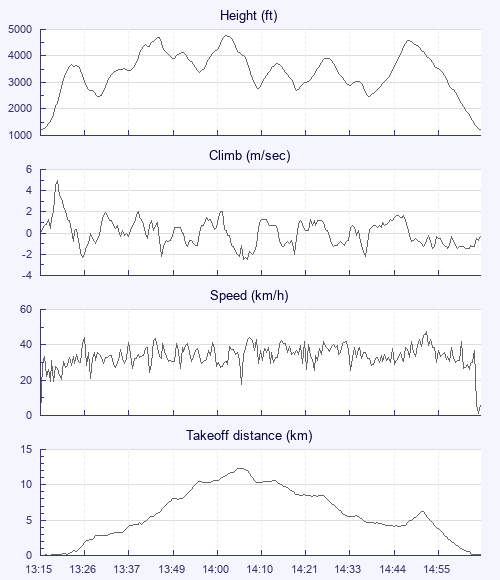
| Height - GPS data | |
| Maximum Height [14:02:48] |
4757 ft |
| Lowest Save [13:30:13] |
2461 ft |
| Takeoff Height [13:15:36] |
1207 ft |
| Landing Height [15:06:30] |
1227 ft |
| Total Ascent | 10955 ft |
| Height Gain | |
| Above Takeoff | 3550 ft |
| Maximum | 3553 ft |
| Low Point [13:15:42] |
1204 ft |
| High Point as Maximum Height |
4757 ft |
| Units | |
| Climb - GPS data | |
| Maximum Climb [13:19:42] |
5.0 m/s |
| Minimum Climb [14:05:54] |
-2.5 m/s |
| Units | |
| Speed | |
| Maximum Speed [14:53:06] |
47.4 km/h |
| Average Speed around course |
15.3 km/h |
| Average Speed over track length |
33.3 km/h |
| Units | |
| Tracklog | |
| Flight Duration | 1hr 50mins |
| Track Points | 2219 |
| Recording Interval | 3 secs |
| Statistics Interval | 6 secs |
| Track Length | 61.6 km |
| Units | |
| Height: | |
| Speed: | |
| Climb: | |
| Distance: |
| Main Map: |
| First Tab: |