


| Duration | 0:00 | Takeoff Distance | 0 |
| Height: | metres |
| Climb: | m/sec |
| Speed: | km/h |
| Distance: | km |
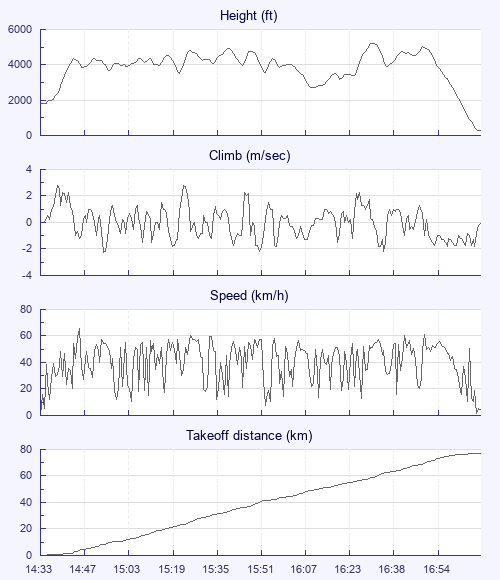
| Height - GPS data | |
| Maximum Height [16:35:06] |
5233 ft |
| Lowest Save [16:13:45] |
2703 ft |
| Takeoff Height [14:33:53] |
1795 ft |
| Landing Height [17:14:10] |
269 ft |
| Total Ascent | 13698 ft |
| Height Gain | |
| Above Takeoff | 3438 ft |
| Maximum | 3445 ft |
| Low Point [14:34:23] |
1788 ft |
| High Point as Maximum Height |
5233 ft |
| Units | |
| Climb - GPS data | |
| Maximum Climb [14:38:17] |
2.8 m/s |
| Minimum Climb [14:55:29] |
-2.3 m/s |
| Units | |
| Speed | |
| Maximum Speed [14:46:29] |
65.4 km/h |
| Average Speed around course |
30.5 km/h |
| Average Speed over track length |
39.9 km/h |
| Units | |
| Tracklog | |
| Flight Duration | 2hrs 40mins |
| Track Points | 3206 |
| Recording Interval | 3 secs |
| Statistics Interval | 6 secs |
| Track Length | 106.7 km |
| Units | |
| Flight instrument - reported as | |
| 5030, SN05473, SW1.14 |
| Height: | |
| Speed: | |
| Climb: | |
| Distance: |
| Main Map: |
| First Tab: |