


| Duration | 0:00 | Takeoff Distance | 0 |
| Height: | metres |
| Climb: | m/sec |
| Speed: | km/h |
| Distance: | km |
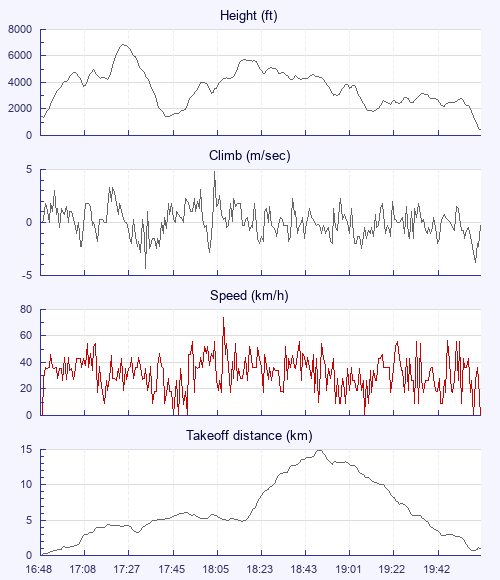
| Height - GPS data | |
| Maximum Height [17:26:08] |
6834 ft |
| Lowest Save [17:44:48] |
1417 ft |
| Takeoff Height [16:48:51] |
1401 ft |
| Landing Height [20:05:50] |
436 ft |
| Total Ascent | 21886 ft |
| Height Gain | |
| Above Takeoff | 5433 ft |
| Maximum | 5469 ft |
| Low Point [16:49:18] |
1365 ft |
| High Point as Maximum Height |
6834 ft |
| Units | |
| Climb - GPS data | |
| Maximum Climb [18:05:40] |
4.8 m/s |
| Minimum Climb [17:35:47] |
-4.3 m/s |
| Units | |
| Speed | |
| Maximum Speed [18:08:58] |
73.8 km/h |
| Average Speed around course |
8.3 km/h |
| Average Speed over track length |
32.8 km/h |
| Units | |
| Tracklog | |
| Flight Duration | 3hrs 16mins |
| Track Points | 11820 |
| Recording Interval | 1 secs |
| Statistics Interval | 4 secs |
| Track Length | 107.6 km |
| Invalid Positions [< 1%] |
31 |
| Units | |
| Height: | |
| Speed: | |
| Climb: | |
| Distance: |
| Main Map: |
| First Tab: |