


| Duration | 0:00 | Takeoff Distance | 0 |
| Height: | metres |
| Climb: | m/sec |
| Speed: | km/h |
| Distance: | km |
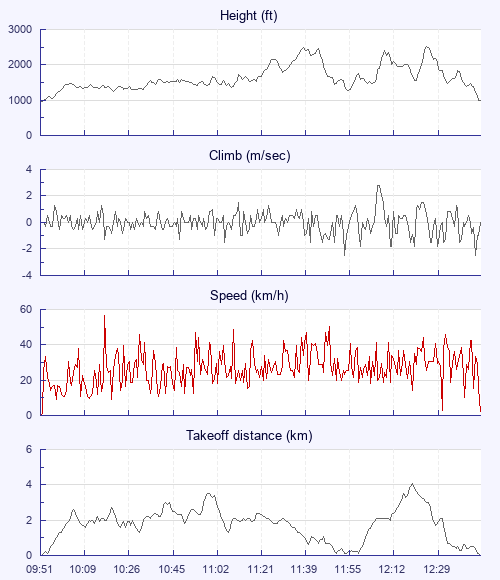
| Height - GPS data | |
| Maximum Height [12:27:33] |
2520 ft |
| Lowest Save [11:56:32] |
1270 ft |
| Takeoff Height [09:51:32] |
968 ft |
| Landing Height [12:47:15] |
978 ft |
| Total Ascent | 12707 ft |
| Height Gain | |
| Above Takeoff | 1552 ft |
| Maximum | 1555 ft |
| Low Point [09:51:34] |
965 ft |
| High Point as Maximum Height |
2520 ft |
| Units | |
| Climb - Pressure data | |
| Maximum Climb [12:08:36] |
2.8 m/s |
| Minimum Climb [11:55:52] |
-2.5 m/s |
| Units | |
| Speed | |
| Maximum Speed [10:17:40] |
56.7 km/h |
| Average Speed around course |
5.9 km/h |
| Average Speed over track length |
27.4 km/h |
| Units | |
| Tracklog | |
| Flight Duration | 2hrs 55mins |
| Track Points | 10544 |
| Recording Interval | 1 secs |
| Statistics Interval | 4 secs |
| Track Length | 80.3 km |
| Invalid Positions [< 1%] |
1 |
| Units | |
| Flight instrument | |
| Type | Samsung Sm-j530f 9 |
| Model | Not Set |
| Firmware | 0.9.4.5-beta |
| Height: | |
| Speed: | |
| Climb: | |
| Distance: |
| Main Map: |
| First Tab: |