


| Duration | 0:00 | Takeoff Distance | 0 |
| Height: | metres |
| Climb: | m/sec |
| Speed: | km/h |
| Distance: | km |
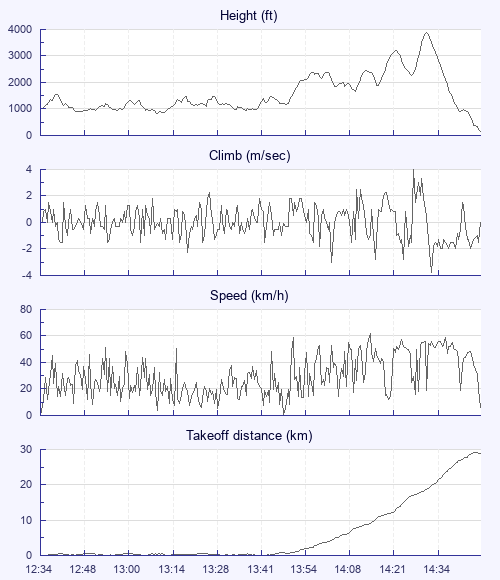
| Height - GPS data | |
| Maximum Height [14:33:19] |
3888 ft |
| Lowest Save [13:10:03] |
843 ft |
| Takeoff Height [12:34:45] |
965 ft |
| Landing Height [14:47:45] |
144 ft |
| Total Ascent | 12657 ft |
| Height Gain | |
| Above Takeoff | 2923 ft |
| Maximum | 3045 ft |
| Low Point as Lowest Save |
843 ft |
| High Point as Maximum Height |
3888 ft |
| Units | |
| Climb - Pressure data | |
| Maximum Climb [14:29:41] |
4.0 m/s |
| Minimum Climb [14:34:21] |
-3.8 m/s |
| Units | |
| Speed | |
| Maximum Speed [14:16:13] |
62.1 km/h |
| Average Speed around course |
15.9 km/h |
| Average Speed over track length |
30.5 km/h |
| Units | |
| Tracklog | |
| Flight Duration | 2hrs 13mins |
| Track Points | 7981 |
| Recording Interval | 1 secs |
| Statistics Interval | 4 secs |
| Track Length | 67.6 km |
| Units | |
| Flight instrument | |
| Type | Oudie 4 |
| Model | Not Set |
| Firmware | 9.02.001 |
| Height: | |
| Speed: | |
| Climb: | |
| Distance: |
| Main Map: |
| First Tab: |