Xc Title
User:Guest
Cloudbase Paragliding advert
John Turczak  All flights
National League 2019
Flight type image
Turnpoint Flight on a Paraglider
Club
Southern
Glider
Niviuk Artik 4
Date
30th March 2019
Start
11:48
Finish
13:47
Duration
1hr 59mins
Takeoff
Mount Caburn
Landing
Burwash
Coords
Takeoff
50.86128, 0.05102
Start
50.85957, 0.04953
TP1
50.91243, 0.08083
TP2
50.91567, 0.21538
TP3
50.92130, 0.20443
Finish
50.97570, 0.34502
Landing
50.97453, 0.34367
Distances and Score
Leg 1
6.28k
Leg 2
9.47k
Leg 3
0.99k
Leg 4
11.59k
Total
28.33k
Score
28.3
Open Distance
Total
24.5k
Filename
Use full pilot name
Download
Validated
Yes
Flight map
Notes

This map gives an overview of the flight, using the turnpoints to plot the track.

Use the for a detailed map and flight track.

Duration 0:00   Takeoff Distance 0
Controls
To animate the flight: click a point on the track, use the slider, or click the Play button.
slider
slider
Speed
Speed
Slower
Faster
Track color
No data
Highlights
Track data
Time: No data
Height:
Climb:
Speed:
Interval:
Units
Height: metres
Climb: m/sec
Speed: km/h
Distance: km
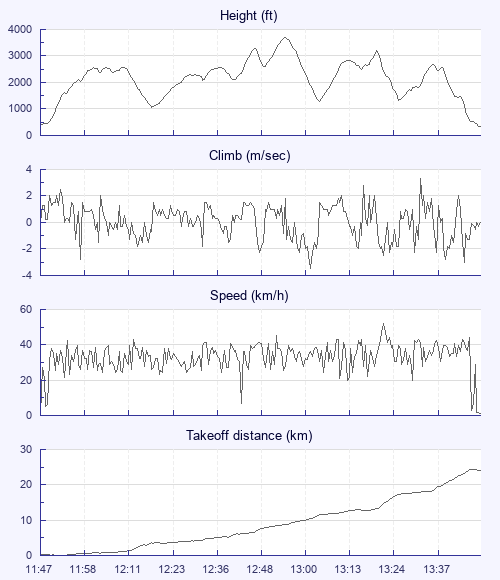
chart
Notes

Climb and Speed averaged over 4 second intervals.

These values may be lower than those shown by a flight instrument, which has access to continuous raw data.

Metric units are used for all chart data, except for Height which is shown in feet.

Height   -   GPS data
Maximum Height
[12:55:59]
3701 ft
Lowest Save
[12:18:14]
1063 ft
Takeoff Height
[11:47:23]
456 ft
Landing Height
[13:48:39]
335 ft
Total Ascent 12959 ft
Height Gain
Above Takeoff 3245 ft
Maximum 3294 ft
Low Point
[11:47:39]
407 ft
High Point
as Maximum Height
3701 ft
Units
Climb   -   Pressure data
Maximum Climb
[13:33:07]
3.3 m/s
Minimum Climb
[13:02:51]
-3.5 m/s
Units
Speed
Maximum Speed
[13:22:51]
52.2 km/h
Average Speed
around course
14.2 km/h
Average Speed
over track length
33.7 km/h
Units
Tracklog
Flight Duration 2hrs 1min
Track Points 7277
Recording Interval 1 secs
Statistics Interval 4 secs
Track Length 68.1 km
Units
Flight instrument
Type Syride
Model Sys'Nav
Firmware 3.31
Notes

Climb and Speed averaged over 4 second intervals.

These values may be lower than those shown by a flight instrument, which has access to continuous raw data.

Average Speed around course is measured from Start to Finish points.

Track Length is the cumulative distance between track points from Takeoff to Landing.

You can change the default units displayed - see the Options page.

It was one of those days where you started off wondering why one Earth you were walking up Caburn with no wind and the sun almost blocked out with haze. But RASP had shown that there was chance of an XC if you get away before the SBF so here I was.

After an hour or so of waiting the first birds could be seen to start going up. One pilot saw something the distance and went for it. Not sure who you were but you showed it was working and got everyone in motion. I followed Boris off the hill who got a climb in the SE breeze close to the hill, I followed him and up we went to around 1500 feet.

We were joined by a few others until we had a gaggle of Mark Rubenstein, Mike Thomas, James Archer and Guy Impey. We then played a very patient waiting game of moving slowly to Ringmer waiting for the conditions to improve. I think the first 10k must have taken about an hour. After a good climb to around 3500 I took off towards the East to push away from the 4500 airspace and the sea breeze that would be chasing us. There was a large area that was now completely in shadow and not producing any lift to get through. I could see one patch where the sun had broken through over a village and a church spire. So headed for that.

That area worked and we all started climbing back up. I then messed up and carried on pushing looking for a 'better' climb. The others stayed back and went up. I was then playing catch up but didn't stay far enough ahead of the sea air so that was me out of it watching the other three climbing up to base a few kilometers ahead, for an extra 25 k.

Still it was great to leave the hill and get back in to XC mode.

Use this page to set various display Options. You can choose which units are used to display flight data, which map to show when the starts and which tab to show each time you view a flight.
Units settings

Metric units are used by default for the Statistics and XC Player pages, except for Height data which is shown in feet. You can choose your own custom settings here.

Height:
Speed:
Climb:
Distance:
  Use default
XC Player settings

When the XC Player starts, the track data is shown on the Hybrid map. You can choose a different map here.

Main Map:
  Use default
Tab settings

The first tab shown when you view a flight is the Flight Map. You can choose a different tab here.

First Tab:
  Use default
Notes

This page uses cookies to save your settings for future visits.

If you have disabled cookies for this site then any changes you make will not be saved.