


| Duration | 0:00 | Takeoff Distance | 0 |
| Height: | metres |
| Climb: | m/sec |
| Speed: | km/h |
| Distance: | km |
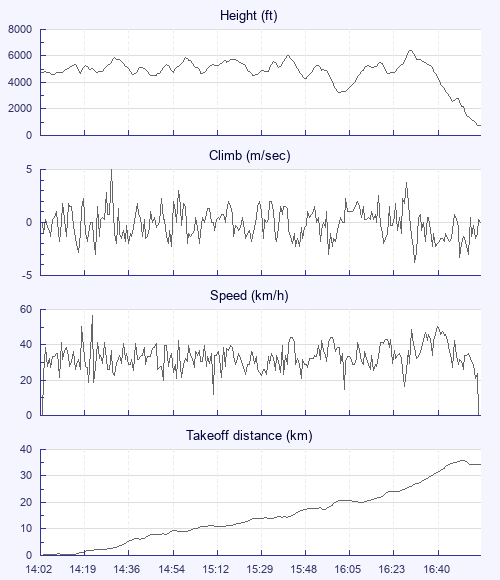
| Height - GPS data | |
| Maximum Height [16:33:26] |
6427 ft |
| Lowest Save [16:04:52] |
3261 ft |
| Takeoff Height [14:02:46] |
4760 ft |
| Landing Height [17:00:01] |
755 ft |
| Total Ascent | 17047 ft |
| Height Gain | |
| Above Takeoff | 1667 ft |
| Maximum | 3166 ft |
| Low Point as Lowest Save |
3261 ft |
| High Point as Maximum Height |
6427 ft |
| Units | |
| Climb - Pressure data | |
| Maximum Climb [14:29:56] |
5.0 m/s |
| Minimum Climb [16:34:36] |
-3.8 m/s |
| Units | |
| Speed | |
| Maximum Speed [14:22:40] |
56.7 km/h |
| Average Speed around course |
15.3 km/h |
| Average Speed over track length |
33.3 km/h |
| Units | |
| Tracklog | |
| Flight Duration | 2hrs 57mins |
| Track Points | 5326 |
| Recording Interval | 2 secs |
| Statistics Interval | 4 secs |
| Track Length | 98.5 km |
| Units | |
| Flight instrument | |
| Type | Oudie 4 |
| Model | Not Set |
| Firmware | 9.15.001 |
| Height: | |
| Speed: | |
| Climb: | |
| Distance: |
| Main Map: |
| First Tab: |