Xc Title
User:Guest
Cloudbase Paragliding advert
Peter Logan  All flights
Dales PG League 2019
Flight type image
Turnpoint Flight on a Paraglider
Club
Dales
Glider
Skywalk Cayenne 5
Date
25th August 2019
Start
13:22
Finish
15:44
Duration
2hrs 22mins
Takeoff
Whernside
Landing
Hill Inn, Ribblesdale
Coords
Takeoff
54.21638, -2.40872
Start
54.20072, -2.42087
TP1
54.22902, -2.40155
TP2
54.19562, -2.39720
TP3
54.23073, -2.39992
Finish
54.19850, -2.38608
Landing
54.19853, -2.38592
Distances and Score
Leg 1
3.39k
Leg 2
3.73k
Leg 3
3.91k
Leg 4
3.70k
Total
14.73k
Score
14.7
Open Distance
Total
3.9k
Filename
Use full pilot name
Download
Validated
Yes
Flight map
Notes

This map gives an overview of the flight, using the turnpoints to plot the track.

Use the for a detailed map and flight track.

Duration 0:00   Takeoff Distance 0
Controls
To animate the flight: click a point on the track, use the slider, or click the Play button.
slider
slider
Speed
Speed
Slower
Faster
Track color
No data
Highlights
Track data
Time: No data
Height:
Climb:
Speed:
Interval:
Units
Height: metres
Climb: m/sec
Speed: km/h
Distance: km
chart
Notes

Climb and Speed averaged over 4 second intervals.

These values may be lower than those shown by a flight instrument, which has access to continuous raw data.

Metric units are used for all chart data, except for Height which is shown in feet.

Height   -   GPS data
Maximum Height
[14:41:29]
3983 ft
Lowest Save
[15:27:58]
2431 ft
Takeoff Height
[12:58:24]
1909 ft
Landing Height
[15:44:30]
1037 ft
Total Ascent 10404 ft
Height Gain
Above Takeoff 2073 ft
Units
Climb   -   GPS data
Maximum Climb
[15:28:32]
3.3 m/s
Minimum Climb
[15:37:32]
-3.5 m/s
Units
Speed
Maximum Speed
[14:43:12]
66.6 km/h
Average Speed
around course
6.2 km/h
Average Speed
over track length
21.5 km/h
Units
Tracklog
Flight Duration 2hrs 46mins
Track Points 9967
Recording Interval 1 secs
Statistics Interval 4 secs
Track Length 59.5 km
Units
Flight instrument   -   reported as
Flymaster F1, V2.3, S/N 968
Notes

Climb and Speed averaged over 4 second intervals.

These values may be lower than those shown by a flight instrument, which has access to continuous raw data.

Average Speed around course is measured from Start to Finish points.

Track Length is the cumulative distance between track points from Takeoff to Landing.

You can change the default units displayed - see the Options page.

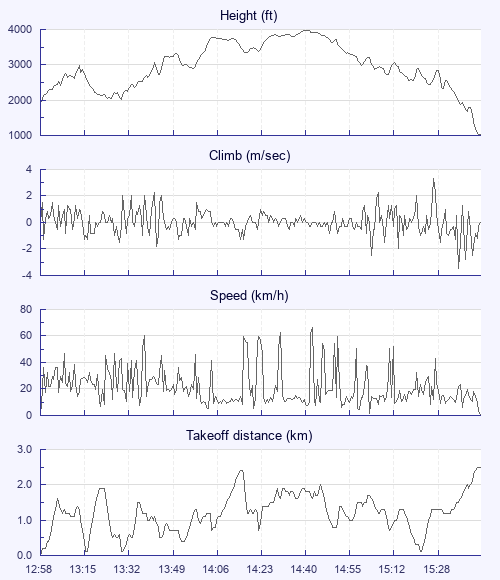
Nice: -) I haven't had a wave flight for a few years. Fascinating, the almost imperceptible way that the thermal climb gave way to the light wave. It was pretty much always below 1m/s and more like 0.2m/s for most of the time up to 1150m. Strongest on Whernside a few hundred m in front of the hill and weakening by the time you're at the main road up through Ribblesdale. I'm collecting a few track logs now to see if I can map out the region at Whernside and Semer. Chris contacted it first and was trying to make his way across to Ingleborough, then went in the direction of Brant Side.

I was in it for an hour or so just weight shifting about with my hands in the pod pockets taking in the view. As the wave moved out of phase and died off OR the inversion started breaking meaning the thermals got higher I was proper nervous as some slight bumps started occurring. You get used to the glass smooth conditioms: -) There was a definite transition time after 2pm when everyone came mostly down out of the wave and had to start thermalling off the ridge again. This coincided with the wind increasing by 5km/h or so and thermal strength occasionally hitting 3m/s but not really worth taking because of the compression effects of the Whernside ridge. I think we could have flopped on to Gragareth later on but we may have got totally punished by the downside of the wave bar.

While up there, there seemed enough N-S extent and height available to start making me think about flying the wave bar north and sniffing out whether it was possible to fly XC toward Great Knoutberry, Hawes or Dodd at all. There was no wave bar cloud to give an obvious route though. It's a thought for next time…

Use this page to set various display Options. You can choose which units are used to display flight data, which map to show when the starts and which tab to show each time you view a flight.
Units settings

Metric units are used by default for the Statistics and XC Player pages, except for Height data which is shown in feet. You can choose your own custom settings here.

Height:
Speed:
Climb:
Distance:
  Use default
XC Player settings

When the XC Player starts, the track data is shown on the Hybrid map. You can choose a different map here.

Main Map:
  Use default
Tab settings

The first tab shown when you view a flight is the Flight Map. You can choose a different tab here.

First Tab:
  Use default
Notes

This page uses cookies to save your settings for future visits.

If you have disabled cookies for this site then any changes you make will not be saved.