


| Duration | 0:00 | Takeoff Distance | 0 |
| Height: | metres |
| Climb: | m/sec |
| Speed: | km/h |
| Distance: | km |
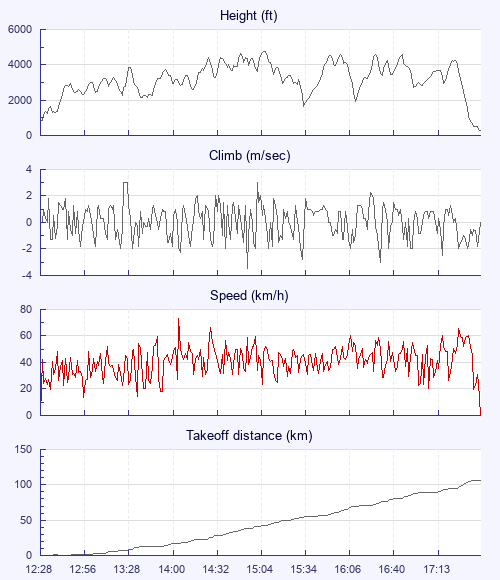
| Height - GPS data | |
| Maximum Height [15:07:59] |
4757 ft |
| Lowest Save [12:36:51] |
1299 ft |
| Takeoff Height [12:28:20] |
843 ft |
| Landing Height [17:47:36] |
266 ft |
| Total Ascent | 36027 ft |
| Height Gain | |
| Above Takeoff | 3914 ft |
| Maximum | 3937 ft |
| Low Point [12:28:34] |
820 ft |
| High Point as Maximum Height |
4757 ft |
| Units | |
| Climb - Pressure data | |
| Maximum Climb [13:26:52] |
3.0 m/s |
| Minimum Climb [14:56:45] |
-3.5 m/s |
| Units | |
| Speed | |
| Maximum Speed [14:06:23] |
73.2 km/h |
| Average Speed around course |
22.1 km/h |
| Average Speed over track length |
40.7 km/h |
| Units | |
| Tracklog | |
| Flight Duration | 5hrs 19mins |
| Track Points | 12506 |
| Recording Interval | 2 secs |
| Statistics Interval | 4 secs |
| Track Length | 216.6 km |
| Invalid Positions [< 1%] |
25 |
| Units | |
| Flight instrument | |
| Type | Flyskyhy |
| Model | 6.13 |
| Firmware | 6.13 |
| Height: | |
| Speed: | |
| Climb: | |
| Distance: |
| Main Map: |
| First Tab: |