


| Duration | 0:00 | Takeoff Distance | 0 |
| Height: | metres |
| Climb: | m/sec |
| Speed: | km/h |
| Distance: | km |
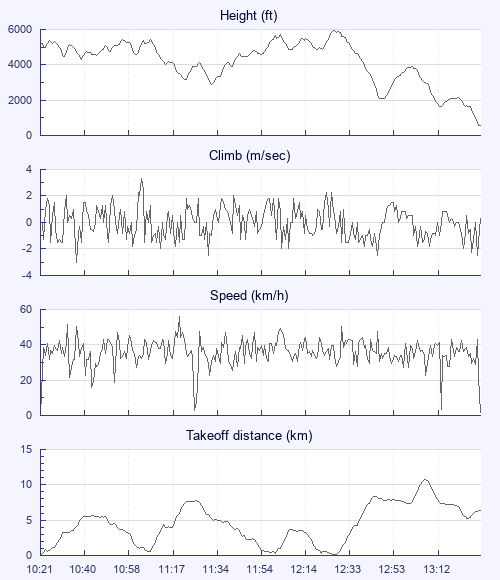
| Height - GPS data | |
| Maximum Height [12:30:52] |
5938 ft |
| Lowest Save [13:18:11] |
1644 ft |
| Takeoff Height [10:21:20] |
5180 ft |
| Landing Height [13:36:00] |
551 ft |
| Total Ascent | 18425 ft |
| Height Gain | |
| Above Takeoff | 758 ft |
| Maximum | 3051 ft |
| Low Point [11:34:57] |
2887 ft |
| High Point as Maximum Height |
5938 ft |
| Units | |
| Climb - Pressure data | |
| Maximum Climb [11:04:52] |
3.3 m/s |
| Minimum Climb [10:37:48] |
-3.0 m/s |
| Units | |
| Speed | |
| Maximum Speed [11:21:36] |
55.8 km/h |
| Average Speed around course |
15.3 km/h |
| Average Speed over track length |
36.4 km/h |
| Units | |
| Tracklog | |
| Flight Duration | 3hrs 14mins |
| Track Points | 11681 |
| Recording Interval | 1 secs |
| Statistics Interval | 4 secs |
| Track Length | 118.2 km |
| Units | |
| Flight instrument | |
| Type | Huawei Bla-l09 9 |
| Model | Not Set |
| Firmware | 0.9.0-beta |
| Height: | |
| Speed: | |
| Climb: | |
| Distance: |
| Main Map: |
| First Tab: |