Xc Title
User:Guest
Naviter advert
Neil Wheeler  All flights
Overseas League 2019
Flight type image
Turnpoint Flight on a Paraglider
Club
Cumbria
Glider
Skywalk Chili 3
Date
3rd August 2019
Start
12:53
Finish
15:03
Duration
2hrs 10mins
Takeoff
St Jean
Landing
Montclar
Coords
Takeoff
44.40255, 6.37145
Start
44.40713, 6.37352
TP1
44.24193, 6.39978
TP2
44.28933, 6.39203
TP3
44.27725, 6.34272
Finish
44.38598, 6.36102
Landing
44.38527, 6.35043
Distances and Score
Leg 1
18.48k
Leg 2
5.30k
Leg 3
4.16k
Leg 4
12.17k
Total
40.11k
Score
40.1
Open Distance
Total
18.5k
Filename
Use full pilot name
Download
Validated
No
Flight map
Notes

This map gives an overview of the flight, using the turnpoints to plot the track.

Use the for a detailed map and flight track.

Duration 0:00   Takeoff Distance 0
Controls
To animate the flight: click a point on the track, use the slider, or click the Play button.
slider
slider
Speed
Speed
Slower
Faster
Track color
No data
Highlights
Track data
Time: No data
Height:
Climb:
Speed:
Interval:
Units
Height: metres
Climb: m/sec
Speed: km/h
Distance: km
chart
Notes

Climb and Speed averaged over 4 second intervals.

These values may be lower than those shown by a flight instrument, which has access to continuous raw data.

Red values indicate suspect data, because the tracklog contains invalid points.

Metric units are used for all chart data, except for Height which is shown in feet.

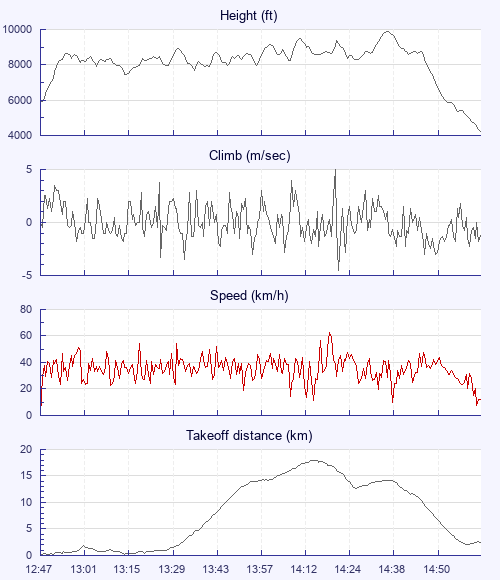
Height   -   Pressure data
Maximum Height
[14:38:28]
9892 ft
Lowest Save
[13:15:09]
7438 ft
Takeoff Height
[12:47:25]
5948 ft
Landing Height
[15:07:33]
4219 ft
Total Ascent 17503 ft
Height Gain
Above Takeoff 3944 ft
Maximum 3980 ft
Low Point
[12:47:40]
5912 ft
High Point
as Maximum Height
9892 ft
Units
Climb   -   Pressure data
Maximum Climb
[14:22:24]
5.0 m/s
Minimum Climb
[14:23:12]
-4.5 m/s
Units
Speed
Maximum Speed
[14:20:56]
63.0 km/h
Average Speed
around course
18.5 km/h
Average Speed
over track length
34.6 km/h
Units
Tracklog
Flight Duration 2hrs 20mins
Track Points 8391
Recording Interval 1 secs
Statistics Interval 4 secs
Track Length 80.8 km
Invalid Positions
[< 1%]
4
Units
Flight instrument
Type Oudie 4 Basic
Model Not Set
Firmware 9.10.001
Notes

Climb and Speed averaged over 4 second intervals.

These values may be lower than those shown by a flight instrument, which has access to continuous raw data.

Red values indicate suspect data, because the tracklog contains invalid points.

Average Speed around course is measured from Start to Finish points.

Track Length is the cumulative distance between track points from Takeoff to Landing.

You can change the default units displayed - see the Options page.

Use this page to set various display Options. You can choose which units are used to display flight data, which map to show when the starts and which tab to show each time you view a flight.
Units settings

Metric units are used by default for the Statistics and XC Player pages, except for Height data which is shown in feet. You can choose your own custom settings here.

Height:
Speed:
Climb:
Distance:
  Use default
XC Player settings

When the XC Player starts, the track data is shown on the Hybrid map. You can choose a different map here.

Main Map:
  Use default
Tab settings

The first tab shown when you view a flight is the Flight Map. You can choose a different tab here.

First Tab:
  Use default
Notes

This page uses cookies to save your settings for future visits.

If you have disabled cookies for this site then any changes you make will not be saved.