Xc Title
User:Guest
UK Airsports advert
Peggy Williams  All flights
Avon League 2019
Flight type image
Tow-launch Turnpoint Flight on a Paraglider
Club
Avon
Glider
Ozone Alpina 3
Date
2nd August 2019
Start
12:47
Finish
18:28
Duration
5hrs 41mins
Takeoff
XClent
Landing
Nr North Dorset District
Coords
Takeoff
51.91137, -1.92545
Start
51.91698, -1.92575
TP1
51.61003, -1.92722
TP2
51.24958, -2.27577
TP3
51.16577, -2.17377
Finish
50.99553, -2.22335
Landing
50.99603, -2.22258
Distances and Score
Leg 1
34.15k
Leg 2
46.86k
Leg 3
11.74k
Leg 4
19.26k
Total
112.01k
Score
112.0
Open Distance
Total
104.6k
Filename
Use full pilot name
Download
Validated
Yes
Flight map
Notes

This map gives an overview of the flight, using the turnpoints to plot the track.

Use the for a detailed map and flight track.

Duration 0:00   Takeoff Distance 0
Controls
To animate the flight: click a point on the track, use the slider, or click the Play button.
slider
slider
Speed
Speed
Slower
Faster
Track color
No data
Highlights
Track data
Time: No data
Height:
Climb:
Speed:
Interval:
Units
Height: metres
Climb: m/sec
Speed: km/h
Distance: km
chart
Notes

Climb and Speed averaged over 4 second intervals.

These values may be lower than those shown by a flight instrument, which has access to continuous raw data.

Red values indicate suspect data, because the tracklog contains invalid points.

Metric units are used for all chart data, except for Height which is shown in feet.

Height   -   Pressure data
Maximum Height
[17:58:50]
5295 ft
Lowest Save
[15:08:02]
1575 ft
Takeoff Height
[12:45:10]
873 ft
Landing Height
[18:29:19]
446 ft
Total Ascent 37221 ft
Height Gain
Above Takeoff 4423 ft
Maximum 4426 ft
Low Point
[12:45:15]
869 ft
High Point
as Maximum Height
5295 ft
Units
Climb   -   Pressure data
Maximum Climb
[12:51:27]
8.6 m/s
Minimum Climb
[15:57:36]
-4.8 m/s
Units
Speed
Maximum Speed
[16:18:54]
55.8 km/h
Average Speed
around course
19.7 km/h
Average Speed
over track length
34.5 km/h
Units
Tracklog
Flight Duration 5hrs 44mins
Track Points 12821
Recording Interval 2 secs
Statistics Interval 4 secs
Track Length 197.7 km
Invalid Heights
[< 1%]
1
Units
Flight instrument
Type Flyskyhy
Model 6.13
Firmware 6.13
Notes

Climb and Speed averaged over 4 second intervals.

These values may be lower than those shown by a flight instrument, which has access to continuous raw data.

Red values indicate suspect data, because the tracklog contains invalid points.

Average Speed around course is measured from Start to Finish points.

Track Length is the cumulative distance between track points from Takeoff to Landing.

You can change the default units displayed - see the Options page.

A very difficult day to know where to go and a last minute decision was made by Ben Friedland and I to go winching.

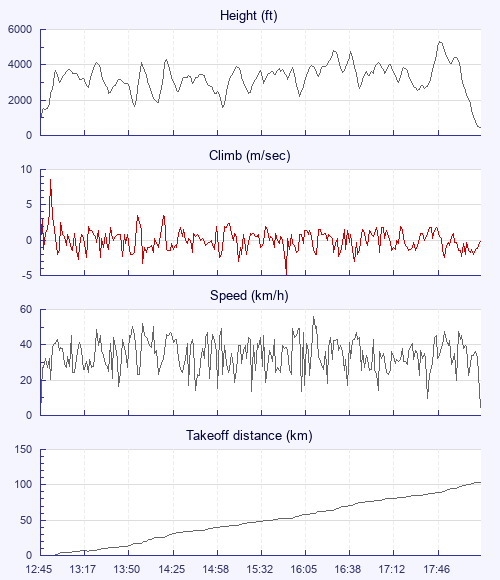
I climbed out on my second tow in a lovely smooth thermal and flew across to where Ben had topped his climb. We then minced around over the A40 under the only sunny patch of ground we could see, for what must have been as least 30 minutes, just waiting for the sky to improve. Once it started to look better we headed south and got a climb over a pig farm, base being just over 3000', which took us to Cirencester. Ben was very low when I spotted a flock of gulls rising to our west. After 2 ½ hours we had only covered 35k and were making slow passage towards Lyneham finding weak climbs along the way. Lyneham gave us less lift than we had hoped but Ben went scouting out over Chippenham and we were both up again, still not getting a lot of height in the very weak lift, spending most of our time at 3-3500' with very little drift too.

The sky was now looking better but it was still a matter of being very patient and working the weak climbs. Leaving Chippenham we headed for Melksham, still following the clouds, and got our first good strong climb from a fire to the west with base now over 4000'. We were now at about 60k after nearly 4 hours but if we could just stay up we thought we may make 100k. We were doing a lot of meandering following the clouds and avoiding the blue hole to the west of Warminster. A good climb under a big cloud with a sailplane up to a base of now over 5000' was enough to confirm the 100k. So we pushed due south with the day now dying to eke out what we could and coming in to land together. We then got a sweet retrieve with the first car that came along who took us to Gillingham Station.

It was a hard day when a lot of patience was required, helped enormously by the fact that there were two of us. Thanks Ben, what a fun flight!

Use this page to set various display Options. You can choose which units are used to display flight data, which map to show when the starts and which tab to show each time you view a flight.
Units settings

Metric units are used by default for the Statistics and XC Player pages, except for Height data which is shown in feet. You can choose your own custom settings here.

Height:
Speed:
Climb:
Distance:
  Use default
XC Player settings

When the XC Player starts, the track data is shown on the Hybrid map. You can choose a different map here.

Main Map:
  Use default
Tab settings

The first tab shown when you view a flight is the Flight Map. You can choose a different tab here.

First Tab:
  Use default
Notes

This page uses cookies to save your settings for future visits.

If you have disabled cookies for this site then any changes you make will not be saved.