


| Duration | 0:00 | Takeoff Distance | 0 |
| Height: | metres |
| Climb: | m/sec |
| Speed: | km/h |
| Distance: | km |
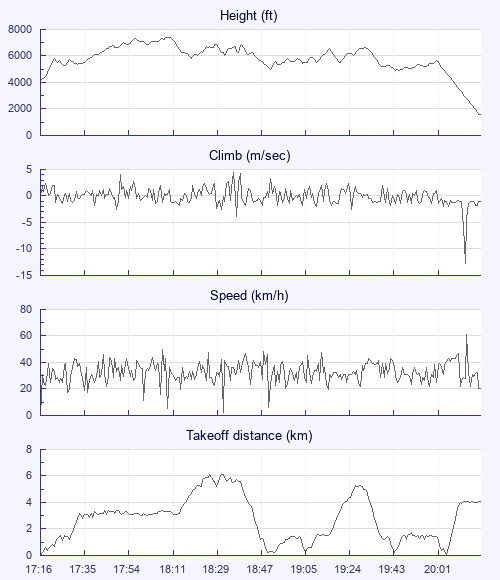
| Height - GPS data | |
| Maximum Height [18:09:17] |
7411 ft |
| Lowest Save [19:44:10] |
4918 ft |
| Takeoff Height [17:16:22] |
4180 ft |
| Landing Height [20:17:25] |
1558 ft |
| Total Ascent | 20614 ft |
| Height Gain | |
| Above Takeoff | 3232 ft |
| Maximum | 3238 ft |
| Low Point [17:16:24] |
4173 ft |
| High Point as Maximum Height |
7411 ft |
| Units | |
| Climb - Pressure data | |
| Maximum Climb [18:35:42] |
4.5 m/s |
| Minimum Climb [20:12:26] |
-12.8 m/s |
| Units | |
| Speed | |
| Maximum Speed [20:12:30] |
61.2 km/h |
| Average Speed around course |
11.9 km/h |
| Average Speed over track length |
33.4 km/h |
| Units | |
| Tracklog | |
| Flight Duration | 3hrs 1min |
| Track Points | 10864 |
| Recording Interval | 1 secs |
| Statistics Interval | 4 secs |
| Track Length | 100.8 km |
| Units | |
| Flight instrument | |
| Type | Syride |
| Model | Sys'Nav |
| Firmware | 3.32 |
| Height: | |
| Speed: | |
| Climb: | |
| Distance: |
| Main Map: |
| First Tab: |