


| Duration | 0:00 | Takeoff Distance | 0 |
| Height: | metres |
| Climb: | m/sec |
| Speed: | km/h |
| Distance: | km |
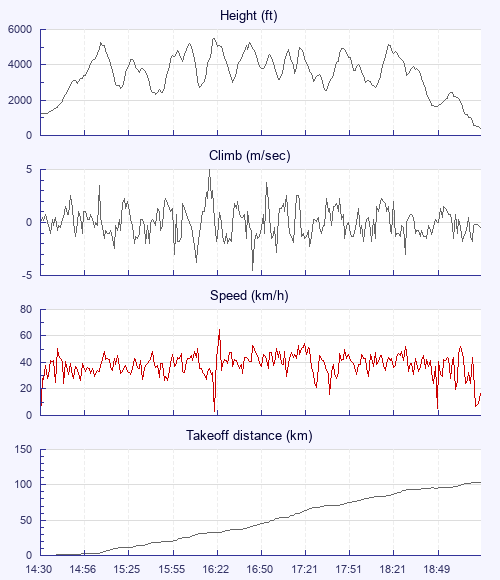
| Height - GPS data | |
| Maximum Height [16:22:43] |
5472 ft |
| Lowest Save [18:51:20] |
1650 ft |
| Takeoff Height [14:30:04] |
1224 ft |
| Landing Height [19:16:58] |
423 ft |
| Total Ascent | 38963 ft |
| Height Gain | |
| Above Takeoff | 4249 ft |
| Maximum | 4278 ft |
| Low Point [14:30:52] |
1194 ft |
| High Point as Maximum Height |
5472 ft |
| Units | |
| Climb - Pressure data | |
| Maximum Climb [16:20:38] |
5.0 m/s |
| Minimum Climb [16:47:49] |
-4.5 m/s |
| Units | |
| Speed | |
| Maximum Speed [16:25:41] |
65.1 km/h |
| Average Speed around course |
23.0 km/h |
| Average Speed over track length |
38.8 km/h |
| Units | |
| Tracklog | |
| Flight Duration | 4hrs 46mins |
| Track Points | 16978 |
| Recording Interval | 1 secs |
| Statistics Interval | 4 secs |
| Track Length | 185.5 km |
| Invalid Positions [< 1%] |
2 |
| Units | |
| Flight instrument | |
| Type | Xc_tracer_mini_ii_gps |
| Model | Not Set |
| Firmware | Xc_tracer_mini_ii_gp |
| Height: | |
| Speed: | |
| Climb: | |
| Distance: |
| Main Map: |
| First Tab: |