


| Duration | 0:00 | Takeoff Distance | 0 |
| Height: | metres |
| Climb: | m/sec |
| Speed: | km/h |
| Distance: | km |
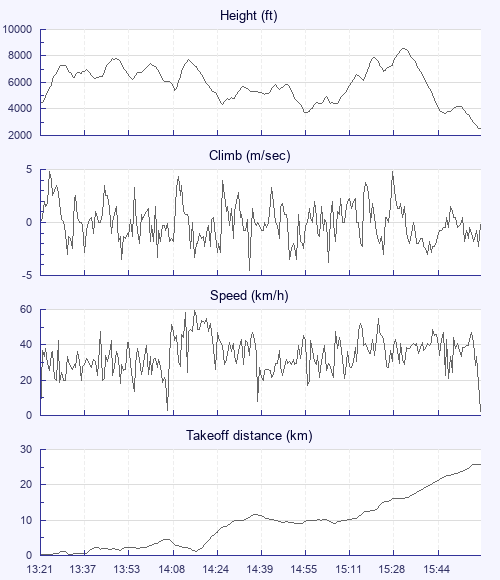
| Height - GPS data | |
| Maximum Height [15:31:55] |
8570 ft |
| Lowest Save [15:46:50] |
3652 ft |
| Takeoff Height [13:21:51] |
4383 ft |
| Landing Height [15:58:42] |
2516 ft |
| Total Ascent | 22513 ft |
| Height Gain | |
| Above Takeoff | 4186 ft |
| Maximum | 4836 ft |
| Low Point [14:56:02] |
3734 ft |
| High Point as Maximum Height |
8570 ft |
| Units | |
| Climb - Pressure data | |
| Maximum Climb [13:25:03] |
4.8 m/s |
| Minimum Climb [14:36:15] |
-4.5 m/s |
| Units | |
| Speed | |
| Maximum Speed [14:16:19] |
59.4 km/h |
| Average Speed around course |
18.1 km/h |
| Average Speed over track length |
34.7 km/h |
| Units | |
| Tracklog | |
| Flight Duration | 2hrs 36mins |
| Track Points | 9413 |
| Recording Interval | 1 secs |
| Statistics Interval | 4 secs |
| Track Length | 90.6 km |
| Units | |
| Flight instrument | |
| Type | Flymaster |
| Model | Nav |
| Firmware | 2.02a |
| Height: | |
| Speed: | |
| Climb: | |
| Distance: |
| Main Map: |
| First Tab: |