


| Duration | 0:00 | Takeoff Distance | 0 |
| Height: | metres |
| Climb: | m/sec |
| Speed: | km/h |
| Distance: | km |
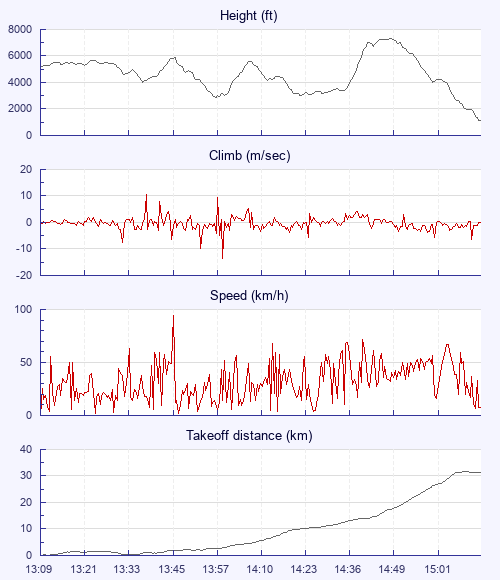
| Height - GPS data | |
| Maximum Height [14:52:18] |
7313 ft |
| Lowest Save [13:59:24] |
2858 ft |
| Takeoff Height [13:09:48] |
5197 ft |
| Landing Height [15:17:27] |
1115 ft |
| Total Ascent | 18852 ft |
| Height Gain | |
| Above Takeoff | 2116 ft |
| Maximum | 4455 ft |
| Low Point as Lowest Save |
2858 ft |
| High Point as Maximum Height |
7313 ft |
| Units | |
| Climb - GPS data | |
| Maximum Climb [13:39:06] |
10.5 m/s |
| Minimum Climb [14:00:50] |
-13.5 m/s |
| Units | |
| Speed | |
| Maximum Speed [13:46:21] |
94.2 km/h |
| Average Speed around course |
18.9 km/h |
| Average Speed over track length |
31.4 km/h |
| Units | |
| Tracklog | |
| Flight Duration | 2hrs 7mins |
| Track Points | 4941 |
| Recording Interval | 2 secs |
| Statistics Interval | 4 secs |
| Track Length | 66.8 km |
| Invalid Positions [< 1%] |
19 |
| Invalid Heights [< 1%] |
27 |
| Units | |
| Flight instrument | |
| Type | Flyskyhy |
| Model | 6.12 |
| Firmware | 6.12 |
| Height: | |
| Speed: | |
| Climb: | |
| Distance: |
| Main Map: |
| First Tab: |