Xc Title
User:Guest
Naviter advert
Robin Wallace  All flights
Overseas League 2019
Flight type image
Turnpoint Flight on a Paraglider
Club
Wessex
Glider
Ozone Rush5
Date
16th June 2019
Start
13:00
Finish
14:14
Duration
1hr 13mins
Takeoff
Forclaz
Landing
Doussard
Coords
Takeoff
45.81437, 6.24643
Start
45.81018, 6.24598
TP1
45.84748, 6.25392
TP2
45.77662, 6.17047
TP3
45.78863, 6.23245
Finish
45.78065, 6.22103
Landing
45.78128, 6.22192
Distances and Score
Leg 1
4.19k
Leg 2
10.20k
Leg 3
5.00k
Leg 4
1.26k
Total
20.65k
Score
20.7
Open Distance
Total
10.2k
Filename
Use full pilot name
Download
Validated
No
Flight map
Notes

This map gives an overview of the flight, using the turnpoints to plot the track.

Use the for a detailed map and flight track.

Duration 0:00   Takeoff Distance 0
Controls
To animate the flight: click a point on the track, use the slider, or click the Play button.
slider
slider
Speed
Speed
Slower
Faster
Track color
No data
Highlights
Track data
Time: No data
Height:
Climb:
Speed:
Interval:
Units
Height: metres
Climb: m/sec
Speed: km/h
Distance: km
chart
Notes

Climb and Speed averaged over 4 second intervals.

These values may be lower than those shown by a flight instrument, which has access to continuous raw data.

Red values indicate suspect data, because the tracklog contains invalid points.

Metric units are used for all chart data, except for Height which is shown in feet.

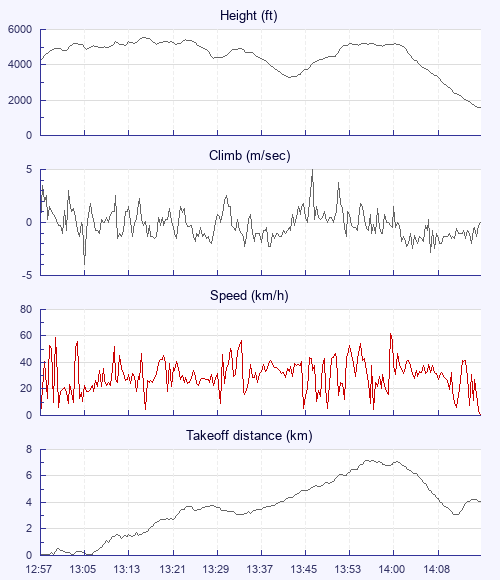
Height   -   Pressure data
Maximum Height
[13:16:52]
5535 ft
Lowest Save
[13:43:01]
3281 ft
Takeoff Height
[12:57:56]
4236 ft
Landing Height
[14:15:40]
1568 ft
Total Ascent 6401 ft
Height Gain
Above Takeoff 1299 ft
Maximum 1959 ft
Low Point
as Lowest Save
3281 ft
High Point
[13:55:57]
5240 ft
Units
Climb   -   Pressure data
Maximum Climb
[13:46:42]
5.0 m/s
Minimum Climb
[13:05:40]
-4.0 m/s
Units
Speed
Maximum Speed
[14:00:17]
62.1 km/h
Average Speed
around course
16.8 km/h
Average Speed
over track length
29.9 km/h
Units
Tracklog
Flight Duration 1hr 17mins
Track Points 4517
Recording Interval 1 secs
Statistics Interval 4 secs
Track Length 38.8 km
Invalid Positions
[< 1%]
11
Units
Flight instrument
Type Flyskyhy
Model 6.12
Firmware 6.12
Notes

Climb and Speed averaged over 4 second intervals.

These values may be lower than those shown by a flight instrument, which has access to continuous raw data.

Red values indicate suspect data, because the tracklog contains invalid points.

Average Speed around course is measured from Start to Finish points.

Track Length is the cumulative distance between track points from Takeoff to Landing.

You can change the default units displayed - see the Options page.

Use this page to set various display Options. You can choose which units are used to display flight data, which map to show when the starts and which tab to show each time you view a flight.
Units settings

Metric units are used by default for the Statistics and XC Player pages, except for Height data which is shown in feet. You can choose your own custom settings here.

Height:
Speed:
Climb:
Distance:
  Use default
XC Player settings

When the XC Player starts, the track data is shown on the Hybrid map. You can choose a different map here.

Main Map:
  Use default
Tab settings

The first tab shown when you view a flight is the Flight Map. You can choose a different tab here.

First Tab:
  Use default
Notes

This page uses cookies to save your settings for future visits.

If you have disabled cookies for this site then any changes you make will not be saved.