


| Duration | 0:00 | Takeoff Distance | 0 |
| Height: | metres |
| Climb: | m/sec |
| Speed: | km/h |
| Distance: | km |
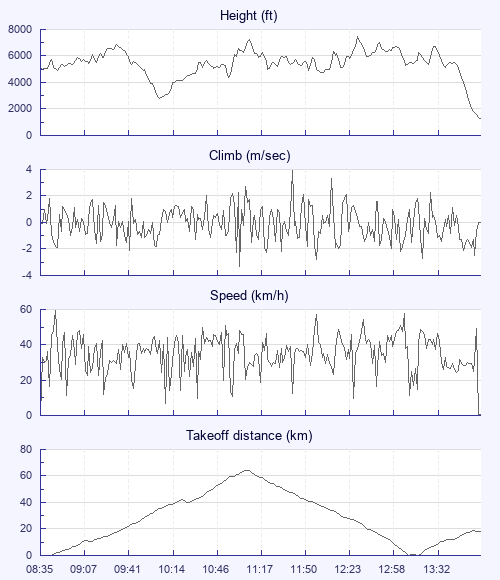
| Height - GPS data | |
| Maximum Height [12:37:12] |
7441 ft |
| Lowest Save [10:07:54] |
2785 ft |
| Takeoff Height [08:35:29] |
5118 ft |
| Landing Height [14:11:58] |
1316 ft |
| Total Ascent | 33501 ft |
| Height Gain | |
| Above Takeoff | 2323 ft |
| Maximum | 4656 ft |
| Low Point as Lowest Save |
2785 ft |
| High Point as Maximum Height |
7441 ft |
| Units | |
| Climb - Pressure data | |
| Maximum Climb [11:46:30] |
3.9 m/s |
| Minimum Climb [11:08:07] |
-3.3 m/s |
| Units | |
| Speed | |
| Maximum Speed [08:44:40] |
59.4 km/h |
| Average Speed around course |
27.3 km/h |
| Average Speed over track length |
35.1 km/h |
| Units | |
| Tracklog | |
| Flight Duration | 5hrs 36mins |
| Track Points | 2018 |
| Recording Interval | 10 secs |
| Statistics Interval | 10 secs |
| Track Length | 196.7 km |
| Units | |
| Flight instrument | |
| Type | Brauniger |
| Model | Compeo+ |
| Firmware | 3.38m |
| Height: | |
| Speed: | |
| Climb: | |
| Distance: |
| Main Map: |
| First Tab: |