


| Duration | 0:00 | Takeoff Distance | 0 |
| Height: | metres |
| Climb: | m/sec |
| Speed: | km/h |
| Distance: | km |
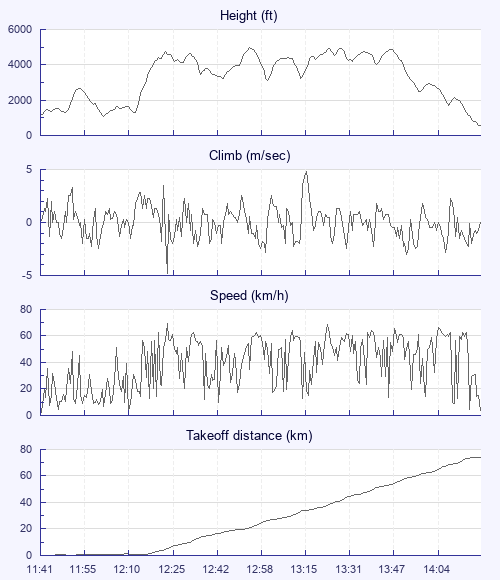
| Height - GPS data | |
| Maximum Height [12:55:06] |
4954 ft |
| Lowest Save [12:02:50] |
1099 ft |
| Takeoff Height [11:41:19] |
1115 ft |
| Landing Height [14:18:43] |
538 ft |
| Total Ascent | 18323 ft |
| Height Gain | |
| Above Takeoff | 3839 ft |
| Maximum | 3855 ft |
| Low Point as Lowest Save |
1099 ft |
| High Point as Maximum Height |
4954 ft |
| Units | |
| Climb - Pressure data | |
| Maximum Climb [13:15:35] |
4.8 m/s |
| Minimum Climb [12:24:19] |
-4.8 m/s |
| Units | |
| Speed | |
| Maximum Speed [12:24:19] |
69.3 km/h |
| Average Speed around course |
30.3 km/h |
| Average Speed over track length |
39.9 km/h |
| Units | |
| Tracklog | |
| Flight Duration | 2hrs 37mins |
| Track Points | 9445 |
| Recording Interval | 1 secs |
| Statistics Interval | 4 secs |
| Track Length | 104.7 km |
| Units | |
| Flight instrument | |
| Type | Oudie 4 |
| Model | Not Set |
| Firmware | 9.13.001 |
| Height: | |
| Speed: | |
| Climb: | |
| Distance: |
| Main Map: |
| First Tab: |