Xc Title
User:Guest
UK Airsports advert
Brian Stewart  All flights
Pennine League 2019
Flight type image
Turnpoint Flight on a Paraglider
Club
Pennine
Glider
Advance Sigma 10
Date
12th May 2019
Start
11:42
Finish
14:42
Duration
3hrs
Takeoff
Parlick
Landing
Barnard Castle
Coords
Takeoff
53.91028, -2.61488
Start
53.91155, -2.61752
TP1
53.94632, -2.53515
TP2
54.34635, -2.27750
TP3
54.50995, -1.94765
Finish
54.53487, -1.94923
Landing
54.53422, -1.95178
Distances and Score
Leg 1
6.65k
Leg 2
47.60k
Leg 3
28.11k
Leg 4
2.78k
Total
85.14k
Score
85.1
Open Distance
Total
82.0k
Filename
Use full pilot name
Download
Validated
Yes
Flight map
Notes

This map gives an overview of the flight, using the turnpoints to plot the track.

Use the for a detailed map and flight track.

Duration 0:00   Takeoff Distance 0
Controls
To animate the flight: click a point on the track, use the slider, or click the Play button.
slider
slider
Speed
Speed
Slower
Faster
Track color
No data
Highlights
Track data
Time: No data
Height:
Climb:
Speed:
Interval:
Units
Height: metres
Climb: m/sec
Speed: km/h
Distance: km
chart
Notes

Climb and Speed averaged over 4 second intervals.

These values may be lower than those shown by a flight instrument, which has access to continuous raw data.

Metric units are used for all chart data, except for Height which is shown in feet.

Height   -   GPS data
Maximum Height
[14:15:59]
7310 ft
Lowest Save
[12:52:50]
2684 ft
Takeoff Height
[11:41:28]
1526 ft
Landing Height
[14:43:26]
755 ft
Total Ascent 24360 ft
Height Gain
Above Takeoff 5784 ft
Units
Climb   -   Pressure data
Maximum Climb
[12:17:40]
5.8 m/s
Minimum Climb
[12:14:40]
-4.8 m/s
Units
Speed
Maximum Speed
[13:53:49]
65.7 km/h
Average Speed
around course
28.3 km/h
Average Speed
over track length
37.7 km/h
Units
Tracklog
Flight Duration 3hrs 1min
Track Points 10915
Recording Interval 1 secs
Statistics Interval 4 secs
Track Length 114.4 km
Units
Flight instrument
Type Xc_tracer_ii
Model Not Set
Firmware Xc_tracer_ii_r09
Notes

Climb and Speed averaged over 4 second intervals.

These values may be lower than those shown by a flight instrument, which has access to continuous raw data.

Average Speed around course is measured from Start to Finish points.

Track Length is the cumulative distance between track points from Takeoff to Landing.

You can change the default units displayed - see the Options page.

Early start, or so I thought, but parking was already mobbed. Westerly forecast lured me to the west face of Parlick, but the smart money was on Fairsnape. First away was Murph, on what looked like a doomed glide, but he worked it and was away. Death glide to Fairsnape: fail. Sweaty walk up, faff, faff while the Jones was next away and climbing out. Stern talking to needed: stop being so desperate!

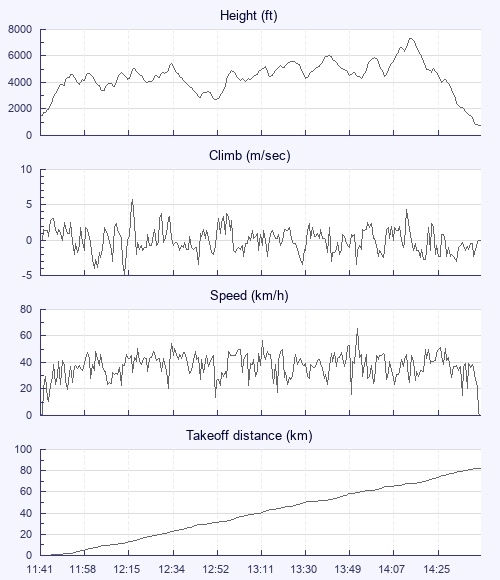
Nice gust, good inflation, off, climbing, phew! Huge clouds, needing massive detours around them, circling on the edges. Stocks reservoir went past, nobody else around, but lots of radio chatter about how rough it was everywhere. Inglebugger coming up, my own bete noir; so often gone down here and it looked the same old story as I approached below summit height. Something's got to work here, surely? Oh boy did it work! The wildest climb I've ever experienced, anywhere. I barely glanced at my instruments but I saw 8.9 m/s, and that wasn't the strongest surge. The tracklog only shows max 5.8 m/s over 4s average - this was the problem with this climb, the strength was varying so much. Much improved nearer the clouds, and I was catching up with the Jones.

Virgin territory now, never flown past here so it took me a while to recognise Dodd and Wether Fell. Somewhere around here I hit 7300 ft, so a UK height PB. And where was my camera? Fabulous cloudscapes all around but they'll just have to live in my memory. I could see Barnard Castle, and always wanted to fly there, as I have friends live locally. That was my downfall, there was still plenty of life in the sky, I could hear Chris F on the radio suggesting a line further inland would be better, but like Ed C said in another storyboard, I'm getting too old to face long sweaty walk outs from the middle of MAMBA, so B C sucked me down.

85 km, no great shakes on such a great day, but a PB that will live in my memory for a very long time and an easy retrieve even if it took ages rounding up some more waifs and strays. OK for an old codger with a bus pass.

Use this page to set various display Options. You can choose which units are used to display flight data, which map to show when the starts and which tab to show each time you view a flight.
Units settings

Metric units are used by default for the Statistics and XC Player pages, except for Height data which is shown in feet. You can choose your own custom settings here.

Height:
Speed:
Climb:
Distance:
  Use default
XC Player settings

When the XC Player starts, the track data is shown on the Hybrid map. You can choose a different map here.

Main Map:
  Use default
Tab settings

The first tab shown when you view a flight is the Flight Map. You can choose a different tab here.

First Tab:
  Use default
Notes

This page uses cookies to save your settings for future visits.

If you have disabled cookies for this site then any changes you make will not be saved.