


| Duration | 0:00 | Takeoff Distance | 0 |
| Height: | metres |
| Climb: | m/sec |
| Speed: | km/h |
| Distance: | km |
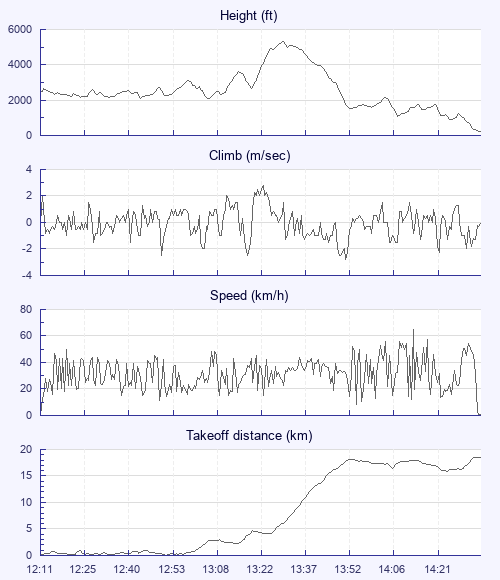
| Height - GPS data | |
| Maximum Height [13:31:27] |
5302 ft |
| Lowest Save [14:29:01] |
889 ft |
| Takeoff Height [12:11:43] |
2408 ft |
| Landing Height [14:37:37] |
223 ft |
| Total Ascent | 15066 ft |
| Height Gain | |
| Above Takeoff | 2894 ft |
| Maximum | 3238 ft |
| Low Point [13:07:06] |
2064 ft |
| High Point as Maximum Height |
5302 ft |
| Units | |
| Climb - Pressure data | |
| Maximum Climb [13:25:00] |
2.8 m/s |
| Minimum Climb [13:53:35] |
-2.8 m/s |
| Units | |
| Speed | |
| Maximum Speed [14:16:11] |
64.8 km/h |
| Average Speed around course |
16.2 km/h |
| Average Speed over track length |
30.3 km/h |
| Units | |
| Tracklog | |
| Flight Duration | 2hrs 25mins |
| Track Points | 4830 |
| Recording Interval | 2 secs |
| Statistics Interval | 4 secs |
| Track Length | 73.8 km |
| Units | |
| Flight instrument | |
| Type | Flyskyhy |
| Model | 6.12 |
| Firmware | 6.12 |
| Height: | |
| Speed: | |
| Climb: | |
| Distance: |
| Main Map: |
| First Tab: |