


| Duration | 0:00 | Takeoff Distance | 0 |
| Height: | metres |
| Climb: | m/sec |
| Speed: | km/h |
| Distance: | km |
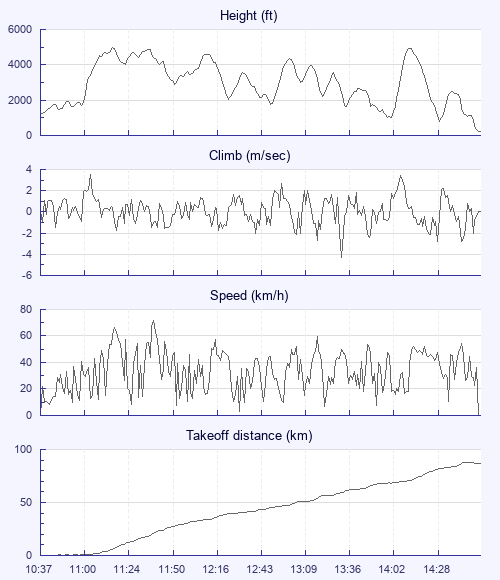
| Height - GPS data | |
| Maximum Height [11:17:21] |
4977 ft |
| Lowest Save [14:37:21] |
804 ft |
| Takeoff Height [10:37:32] |
1230 ft |
| Landing Height [14:58:31] |
236 ft |
| Total Ascent | 24121 ft |
| Height Gain | |
| Above Takeoff | 3747 ft |
| Maximum | 3996 ft |
| Low Point [14:07:41] |
942 ft |
| High Point [14:19:51] |
4938 ft |
| Units | |
| Climb - Pressure data | |
| Maximum Climb [11:04:01] |
3.5 m/s |
| Minimum Climb [13:37:11] |
-4.3 m/s |
| Units | |
| Speed | |
| Maximum Speed [11:41:51] |
71.6 km/h |
| Average Speed around course |
22.5 km/h |
| Average Speed over track length |
33.3 km/h |
| Units | |
| Tracklog | |
| Flight Duration | 4hrs 20mins |
| Track Points | 1577 |
| Recording Interval | 10 secs |
| Statistics Interval | 10 secs |
| Track Length | 144.8 km |
| Units | |
| Height: | |
| Speed: | |
| Climb: | |
| Distance: |
| Main Map: |
| First Tab: |