


| Duration | 0:00 | Takeoff Distance | 0 |
| Height: | metres |
| Climb: | m/sec |
| Speed: | km/h |
| Distance: | km |
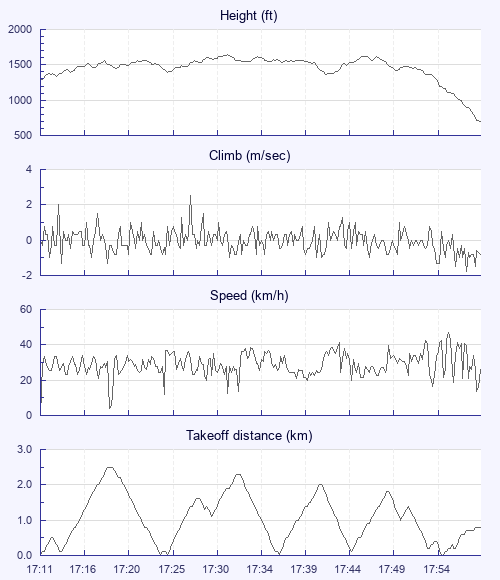
| Height - GPS data | |
| Maximum Height [17:31:20] |
1640 ft |
| Takeoff Height [17:11:15] |
1283 ft |
| Landing Height [17:58:38] |
702 ft |
| Total Ascent | 2474 ft |
| Height Gain | |
| Above Takeoff | 358 ft |
| Units | |
| Climb - Pressure data | |
| Maximum Climb [17:27:23] |
2.5 m/s |
| Minimum Climb [17:57:43] |
-1.8 m/s |
| Units | |
| Speed | |
| Maximum Speed [17:55:59] |
46.8 km/h |
| Average Speed around course |
13.5 km/h |
| Average Speed over track length |
29.4 km/h |
| Units | |
| Tracklog | |
| Flight Duration | 47mins |
| Track Points | 2844 |
| Recording Interval | 1 secs |
| Statistics Interval | 4 secs |
| Track Length | 23.2 km |
| Units | |
| Flight instrument | |
| Type | Syride |
| Model | Sys'Nav |
| Firmware | 3.27 |
| Height: | |
| Speed: | |
| Climb: | |
| Distance: |
| Main Map: |
| First Tab: |