


| Duration | 0:00 | Takeoff Distance | 0 |
| Height: | metres |
| Climb: | m/sec |
| Speed: | km/h |
| Distance: | km |
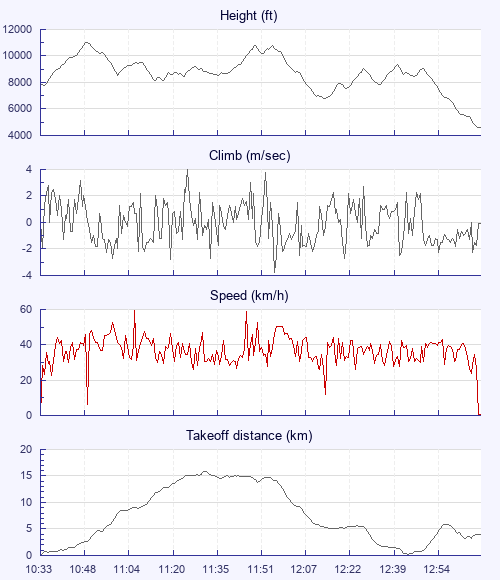
| Height - GPS data | |
| Maximum Height [10:49:47] |
11010 ft |
| Lowest Save [12:15:47] |
6785 ft |
| Takeoff Height [10:33:17] |
7923 ft |
| Landing Height [13:10:39] |
4600 ft |
| Total Ascent | 18491 ft |
| Height Gain | |
| Above Takeoff | 3087 ft |
| Maximum | 3251 ft |
| Low Point [10:34:44] |
7759 ft |
| High Point as Maximum Height |
11010 ft |
| Units | |
| Climb - GPS data | |
| Maximum Climb [11:26:42] |
4.0 m/s |
| Minimum Climb [11:57:49] |
-3.8 m/s |
| Units | |
| Speed | |
| Maximum Speed [11:07:27] |
59.7 km/h |
| Average Speed around course |
16.9 km/h |
| Average Speed over track length |
36.7 km/h |
| Units | |
| Tracklog | |
| Flight Duration | 2hrs 37mins |
| Track Points | 3109 |
| Recording Interval | 3 secs |
| Statistics Interval | 6 secs |
| Track Length | 96.3 km |
| Invalid Positions [< 1%] |
1 |
| Units | |
| Flight instrument - reported as | |
| GPSMap76C Software Version 4.20 |
| Height: | |
| Speed: | |
| Climb: | |
| Distance: |
| Main Map: |
| First Tab: |