


| Duration | 0:00 | Takeoff Distance | 0 |
| Height: | metres |
| Climb: | m/sec |
| Speed: | km/h |
| Distance: | km |
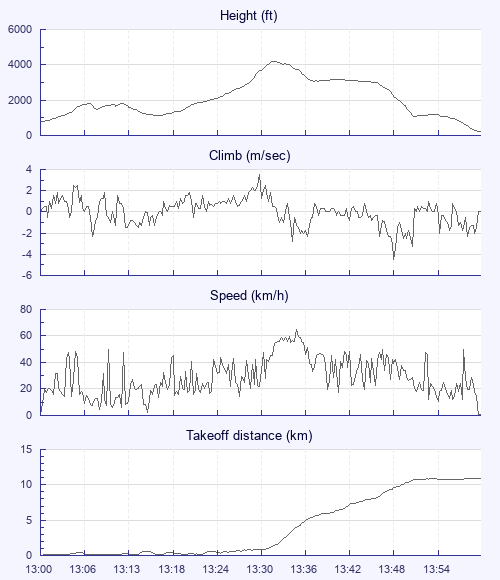
| Height - GPS data | |
| Maximum Height [13:32:28] |
4177 ft |
| Lowest Save [13:17:03] |
1106 ft |
| Takeoff Height [13:00:40] |
778 ft |
| Landing Height [14:00:46] |
233 ft |
| Total Ascent | 5837 ft |
| Height Gain | |
| Above Takeoff | 3399 ft |
| Units | |
| Climb - Pressure data | |
| Maximum Climb [13:30:24] |
3.5 m/s |
| Minimum Climb [13:48:52] |
-4.5 m/s |
| Units | |
| Speed | |
| Maximum Speed [13:35:16] |
64.8 km/h |
| Average Speed around course |
17.0 km/h |
| Average Speed over track length |
29.2 km/h |
| Units | |
| Tracklog | |
| Flight Duration | 1hr |
| Track Points | 3607 |
| Recording Interval | 1 secs |
| Statistics Interval | 4 secs |
| Track Length | 29.2 km |
| Units | |
| Flight instrument | |
| Type | Oudie 4 |
| Model | Not Set |
| Firmware | 8.03.002 |
| Height: | |
| Speed: | |
| Climb: | |
| Distance: |
| Main Map: |
| First Tab: |