


| Duration | 0:00 | Takeoff Distance | 0 |
| Height: | metres |
| Climb: | m/sec |
| Speed: | km/h |
| Distance: | km |
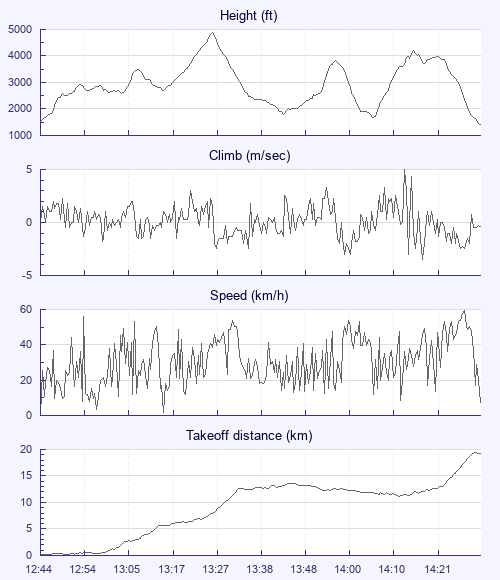
| Height - GPS data | |
| Maximum Height [13:27:28] |
4885 ft |
| Lowest Save [14:07:11] |
1696 ft |
| Takeoff Height [12:44:24] |
1529 ft |
| Landing Height [14:32:57] |
1430 ft |
| Total Ascent | 12060 ft |
| Height Gain | |
| Above Takeoff | 3356 ft |
| Units | |
| Climb - Pressure data | |
| Maximum Climb [14:14:28] |
5.0 m/s |
| Minimum Climb [14:19:04] |
-3.5 m/s |
| Units | |
| Speed | |
| Maximum Speed [14:29:24] |
59.4 km/h |
| Average Speed around course |
18.5 km/h |
| Average Speed over track length |
30.7 km/h |
| Units | |
| Tracklog | |
| Flight Duration | 1hr 48mins |
| Track Points | 6514 |
| Recording Interval | 1 secs |
| Statistics Interval | 4 secs |
| Track Length | 55.5 km |
| Units | |
| Flight instrument - reported as | |
| Flymaster F1, V1.7, S/N 2067 |
| Height: | |
| Speed: | |
| Climb: | |
| Distance: |
| Main Map: |
| First Tab: |