Xc Title
User:Guest
Cloudbase Paragliding advert
Matt Canning  All flights
National League 2018
Flight type image
Turnpoint Flight on a Paraglider
Club
Derbyshire
Glider
Date
20th May 2018
Start
12:19
Finish
14:57
Duration
2hrs 38mins
Takeoff
Eyam
Landing
Normanton
Coords
Takeoff
53.29667, -1.69962
Start
53.29610, -1.70192
TP1
53.41897, -1.61457
TP2
53.41767, -1.55308
TP3
53.63473, -1.50462
Finish
53.69240, -1.40108
Landing
53.69295, -1.40902
Distances and Score
Leg 1
14.86k
Leg 2
4.09k
Leg 3
24.37k
Leg 4
9.38k
Total
52.70k
Score
52.7
Open Distance
Total
48.4k
Filename
Use full pilot name
Download
Validated
Yes
Flight map
Notes

This map gives an overview of the flight, using the turnpoints to plot the track.

Use the for a detailed map and flight track.

Duration 0:00   Takeoff Distance 0
Controls
To animate the flight: click a point on the track, use the slider, or click the Play button.
slider
slider
Speed
Speed
Slower
Faster
Track color
No data
Highlights
Track data
Time: No data
Height:
Climb:
Speed:
Interval:
Units
Height: metres
Climb: m/sec
Speed: km/h
Distance: km
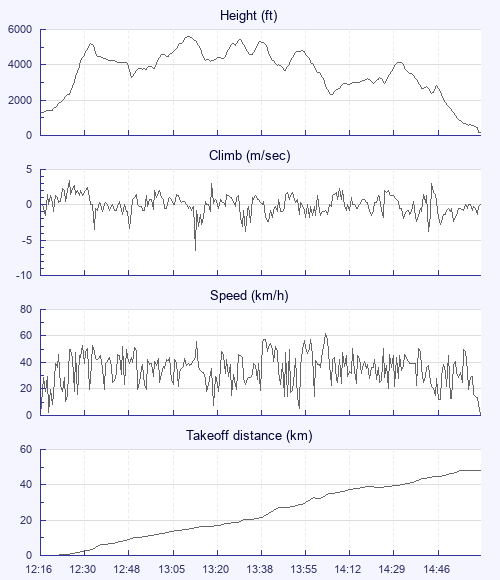
chart
Notes

Climb and Speed averaged over 4 second intervals.

These values may be lower than those shown by a flight instrument, which has access to continuous raw data.

Metric units are used for all chart data, except for Height which is shown in feet.

Height   -   GPS data
Maximum Height
[13:12:30]
5614 ft
Lowest Save
[14:06:50]
2313 ft
Takeoff Height
[12:16:04]
1257 ft
Landing Height
[15:02:37]
151 ft
Total Ascent 16280 ft
Height Gain
Above Takeoff 4357 ft
Units
Climb   -   Pressure data
Maximum Climb
[12:24:57]
3.5 m/s
Minimum Climb
[13:13:58]
-6.5 m/s
Units
Speed
Maximum Speed
[14:04:57]
62.1 km/h
Average Speed
around course
19.9 km/h
Average Speed
over track length
35.3 km/h
Units
Tracklog
Flight Duration 2hrs 46mins
Track Points 9974
Recording Interval 1 secs
Statistics Interval 4 secs
Track Length 97.9 km
Units
Flight instrument
Type Skybean
Model Skydrop
Firmware Build 3466
Notes

Climb and Speed averaged over 4 second intervals.

These values may be lower than those shown by a flight instrument, which has access to continuous raw data.

Average Speed around course is measured from Start to Finish points.

Track Length is the cumulative distance between track points from Takeoff to Landing.

You can change the default units displayed - see the Options page.

Another weekend day, another XC. That's 4 XCs in the last two weekends.

This one was easy and very hard. 5500ft cloudbase and every cloud seemed to work. Tried to crosswind to the east to get around Leeds airspace, but it was all blue to the east, so I was waiting and watching for my opportunity, but it never came. Eventually I found a super strong core right on the edge of the 3000ft airspace which I obviously had to leave. I tried to punch back upwind to the higher airspace, but I wasn't making much headway against the wind, so made a last ditch attempt to dive under the 3000ft, but inevitably landed. Not before watching a bit of a cricket match from 700ft above though.

I planned to land next to the cricket ground, but found some lift that felt like it might be good enough to take so did a couple of circles. In the end it didn't feel good enough to drift low over the town with it. With the wind and the sink I couldn't make it back to the cricket, so ended up landing in the school playing fields on the other side of the road. Befriended a couple of teenagers after they'd called the fire brigade because they thought I was in distress. Luckily I managed talk to the emergency responder before anything was dispatched. She seemed adamant to know that someone was coming to get me. I wonder what would have happened had I truthfully said no. Would I have got a retrieve in a fire engine?

Luckily one of the kids knew someone whose house backed onto the field I'd landed in, so they let me out through their garden rather than having to scale the fence.

I'm well on my way to one of my aims this year - to have 6 flights in the league over 50km. The other is to fly 100km (in the UK). That seems to be really hard. It seems to be some combination of flying quite fast and keeping your concentration for a long time. At the moment I can do one or the other.

Use this page to set various display Options. You can choose which units are used to display flight data, which map to show when the starts and which tab to show each time you view a flight.
Units settings

Metric units are used by default for the Statistics and XC Player pages, except for Height data which is shown in feet. You can choose your own custom settings here.

Height:
Speed:
Climb:
Distance:
  Use default
XC Player settings

When the XC Player starts, the track data is shown on the Hybrid map. You can choose a different map here.

Main Map:
  Use default
Tab settings

The first tab shown when you view a flight is the Flight Map. You can choose a different tab here.

First Tab:
  Use default
Notes

This page uses cookies to save your settings for future visits.

If you have disabled cookies for this site then any changes you make will not be saved.