


| Duration | 0:00 | Takeoff Distance | 0 |
| Height: | metres |
| Climb: | m/sec |
| Speed: | km/h |
| Distance: | km |
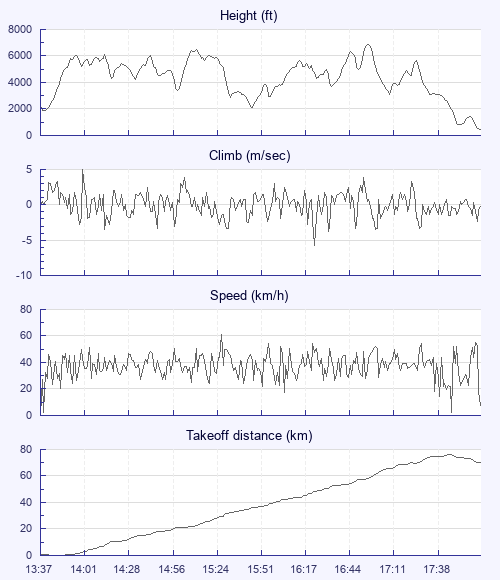
| Height - GPS data | |
| Maximum Height [16:55:49] |
6870 ft |
| Lowest Save [17:49:04] |
804 ft |
| Takeoff Height [13:37:36] |
2152 ft |
| Landing Height [18:00:39] |
469 ft |
| Total Ascent | 34295 ft |
| Height Gain | |
| Above Takeoff | 4718 ft |
| Maximum | 5023 ft |
| Low Point [13:38:27] |
1847 ft |
| High Point as Maximum Height |
6870 ft |
| Units | |
| Climb - Pressure data | |
| Maximum Climb [14:00:11] |
5.0 m/s |
| Minimum Climb [16:23:21] |
-5.8 m/s |
| Units | |
| Speed | |
| Maximum Speed [15:26:58] |
61.2 km/h |
| Average Speed around course |
19.8 km/h |
| Average Speed over track length |
37.3 km/h |
| Units | |
| Tracklog | |
| Flight Duration | 4hrs 23mins |
| Track Points | 15768 |
| Recording Interval | 1 secs |
| Statistics Interval | 4 secs |
| Track Length | 163.4 km |
| Units | |
| Flight instrument | |
| Type | Xc_tracer |
| Model | Not Set |
| Firmware | Xc_tracer_v1.0_r03 |
| Height: | |
| Speed: | |
| Climb: | |
| Distance: |
| Main Map: |
| First Tab: |