


| Duration | 0:00 | Takeoff Distance | 0 |
| Height: | metres |
| Climb: | m/sec |
| Speed: | km/h |
| Distance: | km |
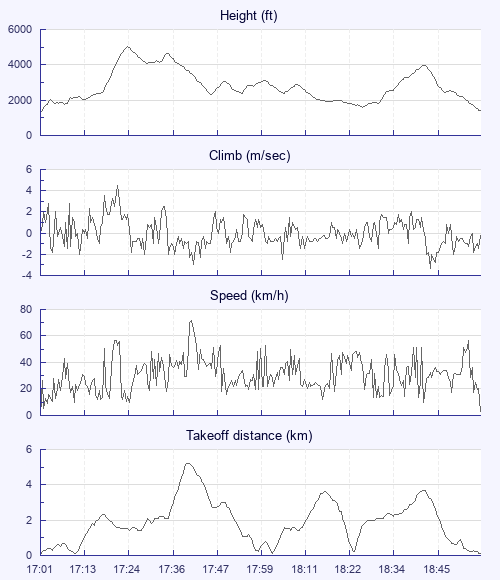
| Height - GPS data | |
| Maximum Height [17:24:27] |
5046 ft |
| Lowest Save [18:27:05] |
1581 ft |
| Takeoff Height [17:01:27] |
1322 ft |
| Landing Height [18:57:47] |
1411 ft |
| Total Ascent | 11824 ft |
| Height Gain | |
| Above Takeoff | 3724 ft |
| Maximum | 3737 ft |
| Low Point [17:01:30] |
1309 ft |
| High Point as Maximum Height |
5046 ft |
| Units | |
| Climb - Pressure data | |
| Maximum Climb [17:22:03] |
4.5 m/s |
| Minimum Climb [18:44:45] |
-3.3 m/s |
| Units | |
| Speed | |
| Maximum Speed [17:41:16] |
72.0 km/h |
| Average Speed around course |
11.6 km/h |
| Average Speed over track length |
31.0 km/h |
| Units | |
| Tracklog | |
| Flight Duration | 1hr 56mins |
| Track Points | 6982 |
| Recording Interval | 1 secs |
| Statistics Interval | 4 secs |
| Track Length | 60.1 km |
| Units | |
| Height: | |
| Speed: | |
| Climb: | |
| Distance: |
| Main Map: |
| First Tab: |