


| Duration | 0:00 | Takeoff Distance | 0 |
| Height: | metres |
| Climb: | m/sec |
| Speed: | km/h |
| Distance: | km |
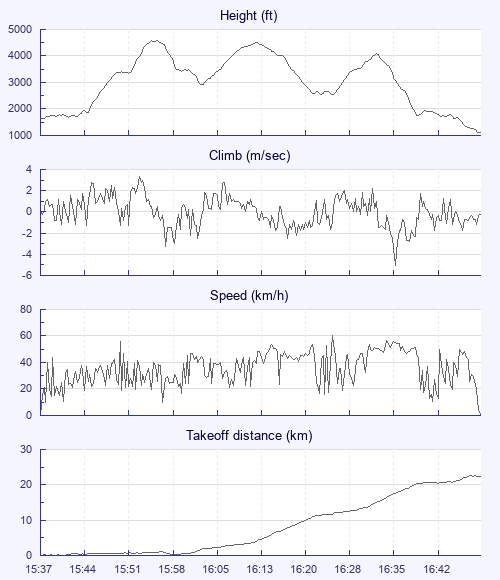
| Height - GPS data | |
| Maximum Height [15:55:19] |
4577 ft |
| Lowest Save [16:23:33] |
2539 ft |
| Takeoff Height [15:37:14] |
1627 ft |
| Landing Height [16:49:15] |
1096 ft |
| Total Ascent | 7664 ft |
| Height Gain | |
| Above Takeoff | 2949 ft |
| Maximum | 2953 ft |
| Low Point [15:37:47] |
1624 ft |
| High Point as Maximum Height |
4577 ft |
| Units | |
| Climb - GPS data | |
| Maximum Climb [15:53:28] |
3.3 m/s |
| Minimum Climb [16:35:36] |
-5.1 m/s |
| Units | |
| Speed | |
| Maximum Speed [16:25:09] |
60.6 km/h |
| Average Speed around course |
22.0 km/h |
| Average Speed over track length |
35.5 km/h |
| Units | |
| Tracklog | |
| Flight Duration | 1hr 12mins |
| Track Points | 1447 |
| Recording Interval | 3 secs |
| Statistics Interval | 6 secs |
| Track Length | 42.6 km |
| Units | |
| Flight instrument - reported as | |
| Digifly LEONARDO , 64.50 |
| Height: | |
| Speed: | |
| Climb: | |
| Distance: |
| Main Map: |
| First Tab: |