Xc Title
User:Guest
Cloudbase Paragliding advert
Tony Wilkinson  All flights
National League 2017
Flight type image
Turnpoint Flight on a Paraglider
Club
Malvern
Glider
Skywalk Cayenne 5
Date
11th April 2017
Start
11:43
Finish
14:10
Duration
2hrs 26mins
Takeoff
Worcester Beacon
Landing
Nr Stratford-on-Avon District
Coords
Takeoff
52.10457, -2.33952
Start
52.10485, -2.34048
TP1
52.09860, -2.34157
TP2
52.10467, -2.20712
TP3
52.10437, -2.21605
Finish
52.09333, -1.49178
Landing
52.09720, -1.49798
Distances and Score
Leg 1
0.70k
Leg 2
9.24k
Leg 3
0.61k
Leg 4
49.65k
Total
60.20k
Score
60.2
Open Distance
Total
58.3k
Filename
Use full pilot name
Download
Validated
Yes
Flight map
Notes

This map gives an overview of the flight, using the turnpoints to plot the track.

Use the for a detailed map and flight track.

Duration 0:00   Takeoff Distance 0
Controls
To animate the flight: click a point on the track, use the slider, or click the Play button.
slider
slider
Speed
Speed
Slower
Faster
Track color
No data
Highlights
Track data
Time: No data
Height:
Climb:
Speed:
Interval:
Units
Height: metres
Climb: m/sec
Speed: km/h
Distance: km
chart
Notes

Climb and Speed averaged over 4 second intervals.

These values may be lower than those shown by a flight instrument, which has access to continuous raw data.

Red values indicate suspect data, because the tracklog contains invalid points.

Metric units are used for all chart data, except for Height which is shown in feet.

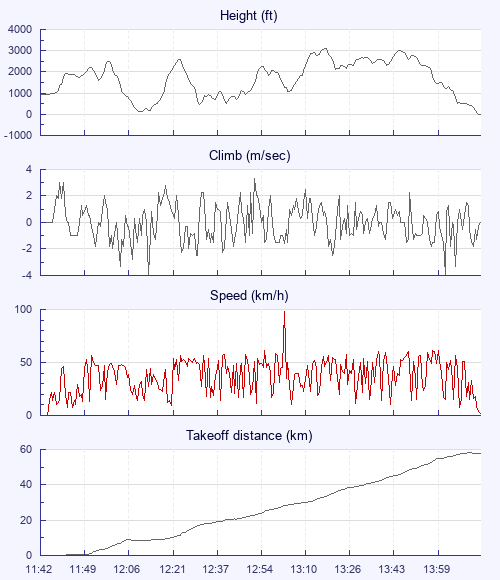
Height   -   Pressure data
Maximum Height
[13:17:55]
3100 ft
Lowest Save
[12:10:30]
141 ft
Takeoff Height
[11:42:20]
925 ft
Landing Height
[14:13:50]
-33 ft
Total Ascent 14918 ft
Height Gain
Above Takeoff 2175 ft
Maximum 2959 ft
Low Point
as Lowest Save
141 ft
High Point
as Maximum Height
3100 ft
Units
Climb   -   Pressure data
Maximum Climb
[12:51:54]
3.3 m/s
Minimum Climb
[12:12:06]
-4.0 m/s
Units
Speed
Maximum Speed
[13:03:23]
97.9 km/h
Average Speed
around course
24.6 km/h
Average Speed
over track length
36.8 km/h
Units
Tracklog
Flight Duration 2hrs 31mins
Track Points 2377
Recording Interval 4 secs
Statistics Interval 4 secs
Track Length 93.0 km
Invalid Positions
[< 1%]
5
Units
Flight instrument
Type Oudie 4
Model Not Set
Firmware 7.21.003
Notes

Climb and Speed averaged over 4 second intervals.

These values may be lower than those shown by a flight instrument, which has access to continuous raw data.

Red values indicate suspect data, because the tracklog contains invalid points.

Average Speed around course is measured from Start to Finish points.

Track Length is the cumulative distance between track points from Takeoff to Landing.

You can change the default units displayed - see the Options page.

Use this page to set various display Options. You can choose which units are used to display flight data, which map to show when the starts and which tab to show each time you view a flight.
Units settings

Metric units are used by default for the Statistics and XC Player pages, except for Height data which is shown in feet. You can choose your own custom settings here.

Height:
Speed:
Climb:
Distance:
  Use default
XC Player settings

When the XC Player starts, the track data is shown on the Hybrid map. You can choose a different map here.

Main Map:
  Use default
Tab settings

The first tab shown when you view a flight is the Flight Map. You can choose a different tab here.

First Tab:
  Use default
Notes

This page uses cookies to save your settings for future visits.

If you have disabled cookies for this site then any changes you make will not be saved.