


| Duration | 0:00 | Takeoff Distance | 0 |
| Height: | metres |
| Climb: | m/sec |
| Speed: | km/h |
| Distance: | km |
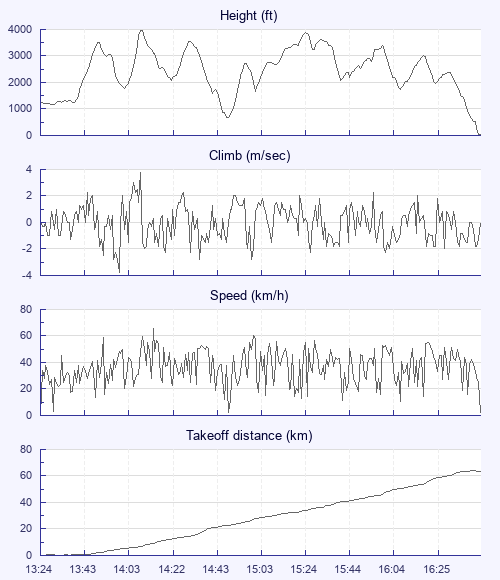
| Height - GPS data | |
| Maximum Height [14:10:29] |
3976 ft |
| Lowest Save [14:50:39] |
682 ft |
| Takeoff Height [13:24:49] |
1220 ft |
| Landing Height [16:48:35] |
33 ft |
| Total Ascent | 20636 ft |
| Height Gain | |
| Above Takeoff | 2756 ft |
| Maximum | 3199 ft |
| Low Point as Lowest Save |
682 ft |
| High Point [15:27:54] |
3881 ft |
| Units | |
| Climb - Pressure data | |
| Maximum Climb [14:10:29] |
3.8 m/s |
| Minimum Climb [14:00:33] |
-3.8 m/s |
| Units | |
| Speed | |
| Maximum Speed [14:15:37] |
65.7 km/h |
| Average Speed around course |
21.0 km/h |
| Average Speed over track length |
37.2 km/h |
| Units | |
| Tracklog | |
| Flight Duration | 3hrs 23mins |
| Track Points | 12226 |
| Recording Interval | 1 secs |
| Statistics Interval | 4 secs |
| Track Length | 126.4 km |
| Units | |
| Height: | |
| Speed: | |
| Climb: | |
| Distance: |
| Main Map: |
| First Tab: |