


| Duration | 0:00 | Takeoff Distance | 0 |
| Height: | metres |
| Climb: | m/sec |
| Speed: | km/h |
| Distance: | km |
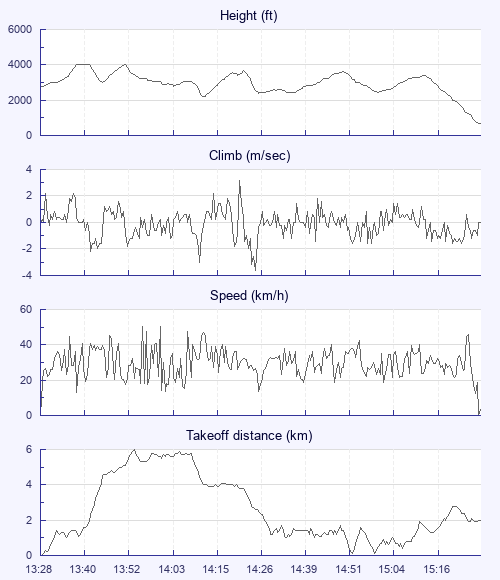
| Height - GPS data | |
| Maximum Height [13:40:11] |
4042 ft |
| Lowest Save [14:13:16] |
2218 ft |
| Takeoff Height [13:28:21] |
2782 ft |
| Landing Height [15:29:24] |
689 ft |
| Total Ascent | 7835 ft |
| Height Gain | |
| Above Takeoff | 1260 ft |
| Maximum | 1460 ft |
| Low Point as Lowest Save |
2218 ft |
| High Point [14:23:33] |
3678 ft |
| Units | |
| Climb - GPS data | |
| Maximum Climb [14:22:43] |
3.2 m/s |
| Minimum Climb [14:26:43] |
-3.6 m/s |
| Units | |
| Speed | |
| Maximum Speed [13:56:01] |
50.4 km/h |
| Average Speed around course |
11.0 km/h |
| Average Speed over track length |
30.1 km/h |
| Units | |
| Tracklog | |
| Flight Duration | 2hrs 1min |
| Track Points | 1454 |
| Recording Interval | 5 secs |
| Statistics Interval | 5 secs |
| Track Length | 60.7 km |
| Units | |
| Flight instrument - reported as | |
| GPSMap60CSX Software Version 4.00 |
| Height: | |
| Speed: | |
| Climb: | |
| Distance: |
| Main Map: |
| First Tab: |