


| Duration | 0:00 | Takeoff Distance | 0 |
| Height: | metres |
| Climb: | m/sec |
| Speed: | km/h |
| Distance: | km |
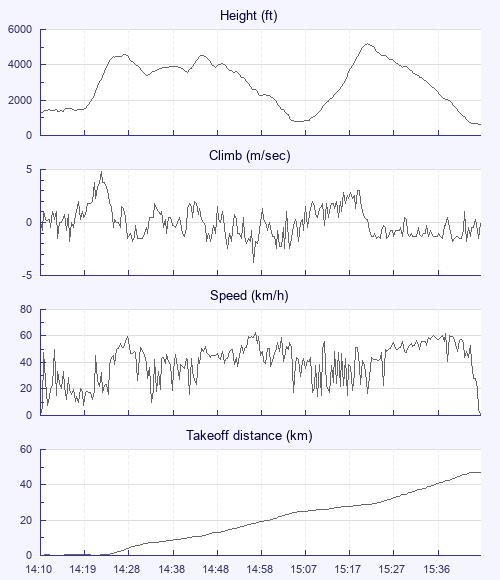
| Height - GPS data | |
| Maximum Height [15:23:07] |
5184 ft |
| Lowest Save [15:07:29] |
774 ft |
| Takeoff Height [14:10:53] |
1322 ft |
| Landing Height [15:47:23] |
620 ft |
| Total Ascent | 11083 ft |
| Height Gain | |
| Above Takeoff | 3862 ft |
| Maximum | 4409 ft |
| Low Point as Lowest Save |
774 ft |
| High Point as Maximum Height |
5184 ft |
| Units | |
| Climb - Pressure data | |
| Maximum Climb [14:23:01] |
4.8 m/s |
| Minimum Climb [14:57:45] |
-3.8 m/s |
| Units | |
| Speed | |
| Maximum Speed [14:57:49] |
63.0 km/h |
| Average Speed around course |
30.9 km/h |
| Average Speed over track length |
40.2 km/h |
| Units | |
| Tracklog | |
| Flight Duration | 1hr 36mins |
| Track Points | 2896 |
| Recording Interval | 2 secs |
| Statistics Interval | 4 secs |
| Track Length | 64.6 km |
| Units | |
| Flight instrument - reported as | |
| Flymaster F1, V1.3, S/N 2928 |
| Height: | |
| Speed: | |
| Climb: | |
| Distance: |
| Main Map: |
| First Tab: |