


| Duration | 0:00 | Takeoff Distance | 0 |
| Height: | metres |
| Climb: | m/sec |
| Speed: | km/h |
| Distance: | km |
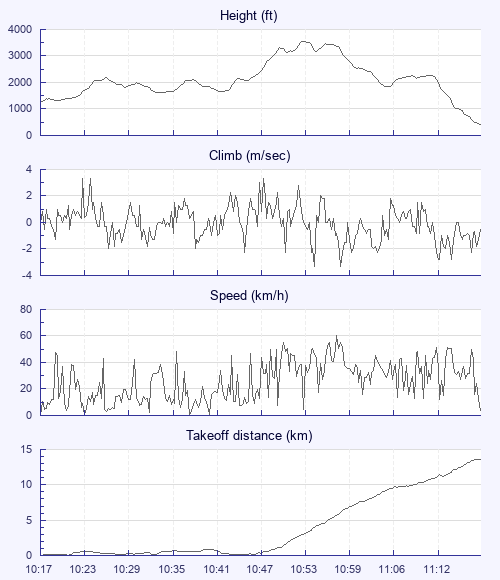
| Height - GPS data | |
| Maximum Height [10:53:25] |
3543 ft |
| Lowest Save [10:33:54] |
1611 ft |
| Takeoff Height [10:17:24] |
1240 ft |
| Landing Height [11:18:01] |
410 ft |
| Total Ascent | 5627 ft |
| Height Gain | |
| Above Takeoff | 2303 ft |
| Units | |
| Climb - Pressure data | |
| Maximum Climb [10:23:32] |
3.3 m/s |
| Minimum Climb [10:55:00] |
-3.3 m/s |
| Units | |
| Speed | |
| Maximum Speed [10:58:04] |
60.3 km/h |
| Average Speed around course |
18.2 km/h |
| Average Speed over track length |
26.4 km/h |
| Units | |
| Tracklog | |
| Flight Duration | 1hr |
| Track Points | 3638 |
| Recording Interval | 1 secs |
| Statistics Interval | 4 secs |
| Track Length | 26.7 km |
| Units | |
| Flight instrument - reported as | |
| SKYTRAXX V1.59 SN:3179839381 |
| Height: | |
| Speed: | |
| Climb: | |
| Distance: |
| Main Map: |
| First Tab: |