


| Duration | 0:00 | Takeoff Distance | 0 |
| Height: | metres |
| Climb: | m/sec |
| Speed: | km/h |
| Distance: | km |
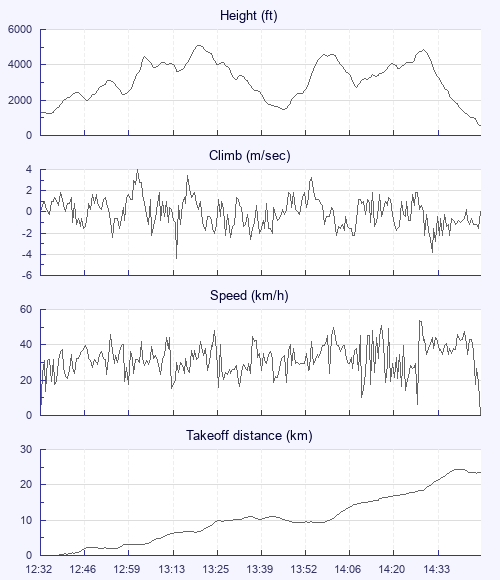
| Height - GPS data | |
| Maximum Height [13:21:58] |
5115 ft |
| Lowest Save [13:47:58] |
1460 ft |
| Takeoff Height [12:32:48] |
1260 ft |
| Landing Height [14:48:38] |
564 ft |
| Total Ascent | 14094 ft |
| Height Gain | |
| Above Takeoff | 3855 ft |
| Maximum | 3888 ft |
| Low Point [12:35:18] |
1227 ft |
| High Point as Maximum Height |
5115 ft |
| Units | |
| Climb - Pressure data | |
| Maximum Climb [13:02:53] |
4.0 m/s |
| Minimum Climb [13:15:18] |
-4.4 m/s |
| Units | |
| Speed | |
| Maximum Speed [14:31:08] |
54.0 km/h |
| Average Speed around course |
14.2 km/h |
| Average Speed over track length |
32.2 km/h |
| Units | |
| Tracklog | |
| Flight Duration | 2hrs 15mins |
| Track Points | 1631 |
| Recording Interval | 5 secs |
| Statistics Interval | 5 secs |
| Track Length | 72.8 km |
| Units | |
| Height: | |
| Speed: | |
| Climb: | |
| Distance: |
| Main Map: |
| First Tab: |