Xc Title
User:Guest
Ozone advert
Roger Brown  All flights
National League 2017
Flight type image
Turnpoint Flight on a Paraglider
Club
Thames Valley
Glider
Gradient Aspen 4
Date
1st June 2017
Start
12:34
Finish
13:54
Duration
1hr 19mins
Takeoff
Milk Hill White Horse
Landing
Nr Uffington White Horse
Coords
Takeoff
51.37208, -1.85533
Start
51.37133, -1.85750
TP1
51.37537, -1.85242
TP2
51.36875, -1.86133
TP3
51.42547, -1.85767
Finish
51.58442, -1.58705
Landing
51.58372, -1.58675
Distances and Score
Leg 1
0.57k
Leg 2
0.96k
Leg 3
6.32k
Leg 4
25.80k
Total
33.65k
Score
33.7
Open Distance
Total
30.6k
Filename
Use full pilot name
Download
Validated
Yes
Flight map
Notes

This map gives an overview of the flight, using the turnpoints to plot the track.

Use the for a detailed map and flight track.

Duration 0:00   Takeoff Distance 0
Controls
To animate the flight: click a point on the track, use the slider, or click the Play button.
slider
slider
Speed
Speed
Slower
Faster
Track color
No data
Highlights
Track data
Time: No data
Height:
Climb:
Speed:
Interval:
Units
Height: metres
Climb: m/sec
Speed: km/h
Distance: km
chart
Notes

Climb and Speed averaged over 4 second intervals.

These values may be lower than those shown by a flight instrument, which has access to continuous raw data.

Metric units are used for all chart data, except for Height which is shown in feet.

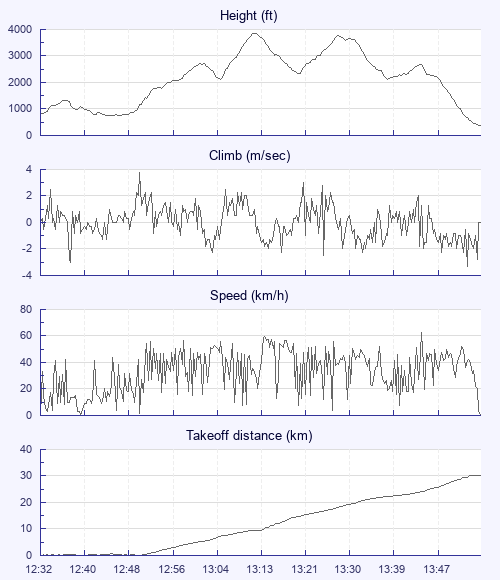
Height   -   Pressure data
Maximum Height
[13:12:13]
3862 ft
Lowest Save
[13:05:41]
2096 ft
Takeoff Height
[12:32:21]
801 ft
Landing Height
[13:55:09]
390 ft
Total Ascent 7740 ft
Height Gain
Above Takeoff 3061 ft
Maximum 3120 ft
Low Point
[12:46:37]
741 ft
High Point
as Maximum Height
3862 ft
Units
Climb   -   Pressure data
Maximum Climb
[12:50:17]
3.8 m/s
Minimum Climb
[13:53:45]
-3.3 m/s
Units
Speed
Maximum Speed
[13:45:01]
63.0 km/h
Average Speed
around course
25.3 km/h
Average Speed
over track length
33.3 km/h
Units
Tracklog
Flight Duration 1hr 22mins
Track Points 1243
Recording Interval 4 secs
Statistics Interval 4 secs
Track Length 45.9 km
Units
Flight instrument   -   reported as
XC Trainer V3.5-01, S/N 4129
Notes

Climb and Speed averaged over 4 second intervals.

These values may be lower than those shown by a flight instrument, which has access to continuous raw data.

Average Speed around course is measured from Start to Finish points.

Track Length is the cumulative distance between track points from Takeoff to Landing.

You can change the default units displayed - see the Options page.

Use this page to set various display Options. You can choose which units are used to display flight data, which map to show when the starts and which tab to show each time you view a flight.
Units settings

Metric units are used by default for the Statistics and XC Player pages, except for Height data which is shown in feet. You can choose your own custom settings here.

Height:
Speed:
Climb:
Distance:
  Use default
XC Player settings

When the XC Player starts, the track data is shown on the Hybrid map. You can choose a different map here.

Main Map:
  Use default
Tab settings

The first tab shown when you view a flight is the Flight Map. You can choose a different tab here.

First Tab:
  Use default
Notes

This page uses cookies to save your settings for future visits.

If you have disabled cookies for this site then any changes you make will not be saved.