Xc Title
User:Guest
Cloudbase Paragliding advert
Mike Byfield  All flights
National League 2017
Flight type image
Turnpoint Flight on a Paraglider
Club
Thames Valley
Glider
Advance Sigma 9
Date
21st May 2017
Start
12:30
Finish
14:51
Duration
2hrs 20mins
Takeoff
Milk Hill White Horse
Landing
Toddington
Coords
Takeoff
51.37198, -1.85625
Start
51.37272, -1.85157
TP1
51.37008, -1.86000
TP2
51.71598, -1.98917
TP3
51.98873, -1.97833
Finish
51.99092, -1.95368
Landing
51.99072, -1.95413
Distances and Score
Leg 1
0.66k
Leg 2
39.51k
Leg 3
30.36k
Leg 4
1.71k
Total
72.24k
Score
72.2
Open Distance
Total
69.7k
Filename
Use full pilot name
Download
Validated
Yes
Flight map
Notes

This map gives an overview of the flight, using the turnpoints to plot the track.

Use the for a detailed map and flight track.

Duration 0:00   Takeoff Distance 0
Controls
To animate the flight: click a point on the track, use the slider, or click the Play button.
slider
slider
Speed
Speed
Slower
Faster
Track color
No data
Highlights
Track data
Time: No data
Height:
Climb:
Speed:
Interval:
Units
Height: metres
Climb: m/sec
Speed: km/h
Distance: km
chart
Notes

Climb and Speed averaged over 4 second intervals.

These values may be lower than those shown by a flight instrument, which has access to continuous raw data.

Metric units are used for all chart data, except for Height which is shown in feet.

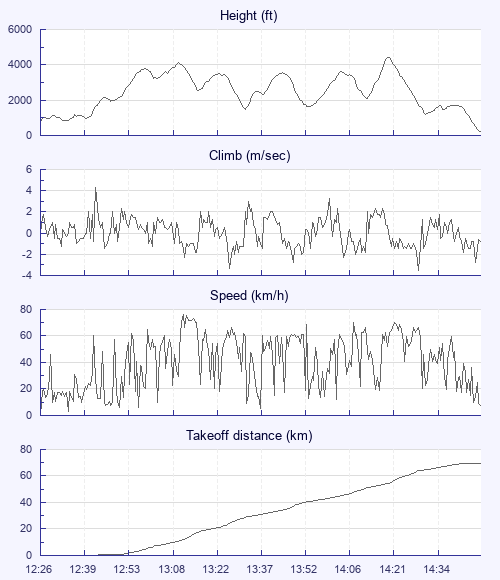
Height   -   GPS data
Maximum Height
[14:22:35]
4413 ft
Lowest Save
[14:34:28]
1201 ft
Takeoff Height
[12:26:17]
820 ft
Landing Height
[14:51:21]
217 ft
Total Ascent 16001 ft
Height Gain
Above Takeoff 3593 ft
Units
Climb   -   Pressure data
Maximum Climb
[12:43:37]
4.3 m/s
Minimum Climb
[14:32:45]
-3.5 m/s
Units
Speed
Maximum Speed
[13:12:45]
76.5 km/h
Average Speed
around course
30.8 km/h
Average Speed
over track length
40.7 km/h
Units
Tracklog
Flight Duration 2hrs 25mins
Track Points 8705
Recording Interval 1 secs
Statistics Interval 4 secs
Track Length 98.3 km
Units
Flight instrument   -   reported as
Flymaster F1, V1.5, S/N 425
Notes

Climb and Speed averaged over 4 second intervals.

These values may be lower than those shown by a flight instrument, which has access to continuous raw data.

Average Speed around course is measured from Start to Finish points.

Track Length is the cumulative distance between track points from Takeoff to Landing.

You can change the default units displayed - see the Options page.

Windy!

I suppose I should say a bit more, but windy pretty much covers the mood, fear, and pace of the day.

Milk Hill and Golden Ball were draped in fog early on so there was little else to do other than sit and chat, and Mike M's van was the ideal spot. By 9.15 ish it all started to clear so Mike, army James and myself grabbed our kit and set off for take-off.

The early morning breeze was strong and smooth at around 14 - 18mph, but this soon changed to strong and a bit boisterous. MHWH is a good spot when conditions are strong, and about 30 pilots were in attendance to give it a go including a 10+ groups from the forces. With conditions marginal at best, a migration down the hill was the only way to get airborne safely.

For a brief spell conditions greatly improved and the sky just seemed to vacuum up all those who dared to take off. Several small groups had already left the hill by the time James P, Charles N, myself and several others managed to get away. Conditions low down were at times extremely rough, the strong winds and punchy thermals creating a fairly hazardous cocktail. But up high, things were a tad more mellow, even pleasant. During the early phases of the flight our gaggle worked well, crossing the M4 high and navigating the narrow South Cerney gap. But just past Cheltenham the cloud cover increased, the lift weakened and James, Charles and myself, the last of our gaggle were down within 3km of each other. 10 mins later, the sky was back to blue.

A great day of flying, farmers offering us lifts to the Pheasant Inn, and taxi drivers just a week into the job all added to the adventure of getting back.

I love this sport!

Use this page to set various display Options. You can choose which units are used to display flight data, which map to show when the starts and which tab to show each time you view a flight.
Units settings

Metric units are used by default for the Statistics and XC Player pages, except for Height data which is shown in feet. You can choose your own custom settings here.

Height:
Speed:
Climb:
Distance:
  Use default
XC Player settings

When the XC Player starts, the track data is shown on the Hybrid map. You can choose a different map here.

Main Map:
  Use default
Tab settings

The first tab shown when you view a flight is the Flight Map. You can choose a different tab here.

First Tab:
  Use default
Notes

This page uses cookies to save your settings for future visits.

If you have disabled cookies for this site then any changes you make will not be saved.