


| Duration | 0:00 | Takeoff Distance | 0 |
| Height: | metres |
| Climb: | m/sec |
| Speed: | km/h |
| Distance: | km |
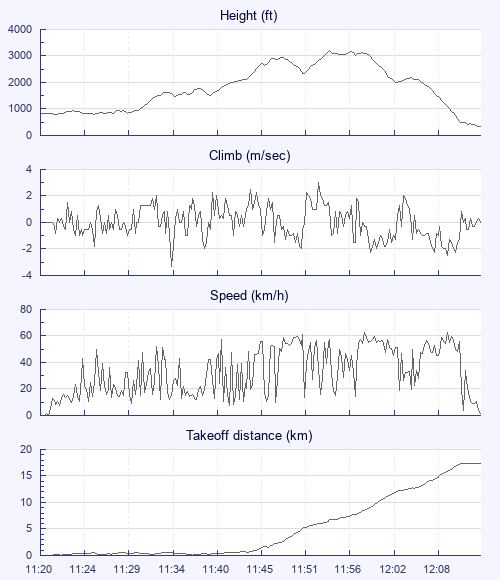
| Height - GPS data | |
| Maximum Height [11:55:45] |
3196 ft |
| Lowest Save [11:52:35] |
2349 ft |
| Takeoff Height [11:20:29] |
817 ft |
| Landing Height [12:15:29] |
348 ft |
| Total Ascent | 5161 ft |
| Height Gain | |
| Above Takeoff | 2379 ft |
| Maximum | 2405 ft |
| Low Point [11:21:39] |
791 ft |
| High Point as Maximum Height |
3196 ft |
| Units | |
| Climb - Pressure data | |
| Maximum Climb [11:54:21] |
3.0 m/s |
| Minimum Climb [11:35:01] |
-3.3 m/s |
| Units | |
| Speed | |
| Maximum Speed [12:00:29] |
63.0 km/h |
| Average Speed around course |
23.2 km/h |
| Average Speed over track length |
34.4 km/h |
| Units | |
| Tracklog | |
| Flight Duration | 55mins |
| Track Points | 1724 |
| Recording Interval | 2 secs |
| Statistics Interval | 4 secs |
| Track Length | 31.5 km |
| Units | |
| Flight instrument | |
| Type | Oudie 3 |
| Model | Not Set |
| Firmware | 7.00.001 |
| Height: | |
| Speed: | |
| Climb: | |
| Distance: |
| Main Map: |
| First Tab: |