


| Duration | 0:00 | Takeoff Distance | 0 |
| Height: | metres |
| Climb: | m/sec |
| Speed: | km/h |
| Distance: | km |
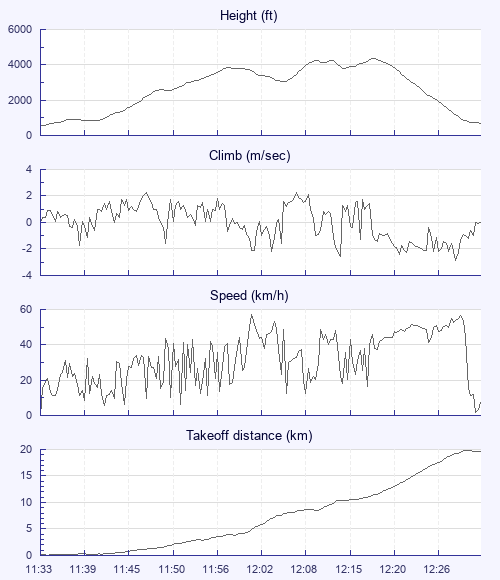
| Height - GPS data | |
| Maximum Height [12:18:01] |
4364 ft |
| Lowest Save [12:05:58] |
3045 ft |
| Takeoff Height [11:33:10] |
591 ft |
| Landing Height [12:31:47] |
679 ft |
| Total Ascent | 5387 ft |
| Height Gain | |
| Above Takeoff | 3773 ft |
| Maximum | 3793 ft |
| Low Point [11:33:40] |
571 ft |
| High Point as Maximum Height |
4364 ft |
| Units | |
| Climb - Pressure data | |
| Maximum Climb [11:47:24] |
2.3 m/s |
| Minimum Climb [12:28:56] |
-2.9 m/s |
| Units | |
| Speed | |
| Maximum Speed [12:01:37] |
56.9 km/h |
| Average Speed around course |
24.6 km/h |
| Average Speed over track length |
31.6 km/h |
| Units | |
| Tracklog | |
| Flight Duration | 58mins |
| Track Points | 347 |
| Recording Interval | 10 secs |
| Statistics Interval | 10 secs |
| Track Length | 30.9 km |
| Units | |
| Flight instrument | |
| Type | Flytec |
| Model | 6030 |
| Firmware | 3.38m |
| Height: | |
| Speed: | |
| Climb: | |
| Distance: |
| Main Map: |
| First Tab: |